Connect to external connectors
RapidCanvas connectors module enables you to interact with different external connectors to import data into the platform and make predictions on this data with the built machine learning models.
List of connectors supported:
Google cloud storage. For more information, see Import data from Google Cloud Storage.
Amazon S3. For more information, see Import data from Amazon S3.
Azure blob. For more information, see Import data from Azure Blob.
MongoDB. For more information, see Import data from Mongo DB.
Snowflake. For more information,see Import data from Snowflake.
MySQL. For more information, see Import data from MySQL.
Importing data from Google Cloud Storage
The data stored on Google cloud services can be imported to the platform by creating a connection to Google cloud storage. The connection can only be created with a valid JSON access key generated after creating a service account.
To import data from GCS:
Hover over the menu icon
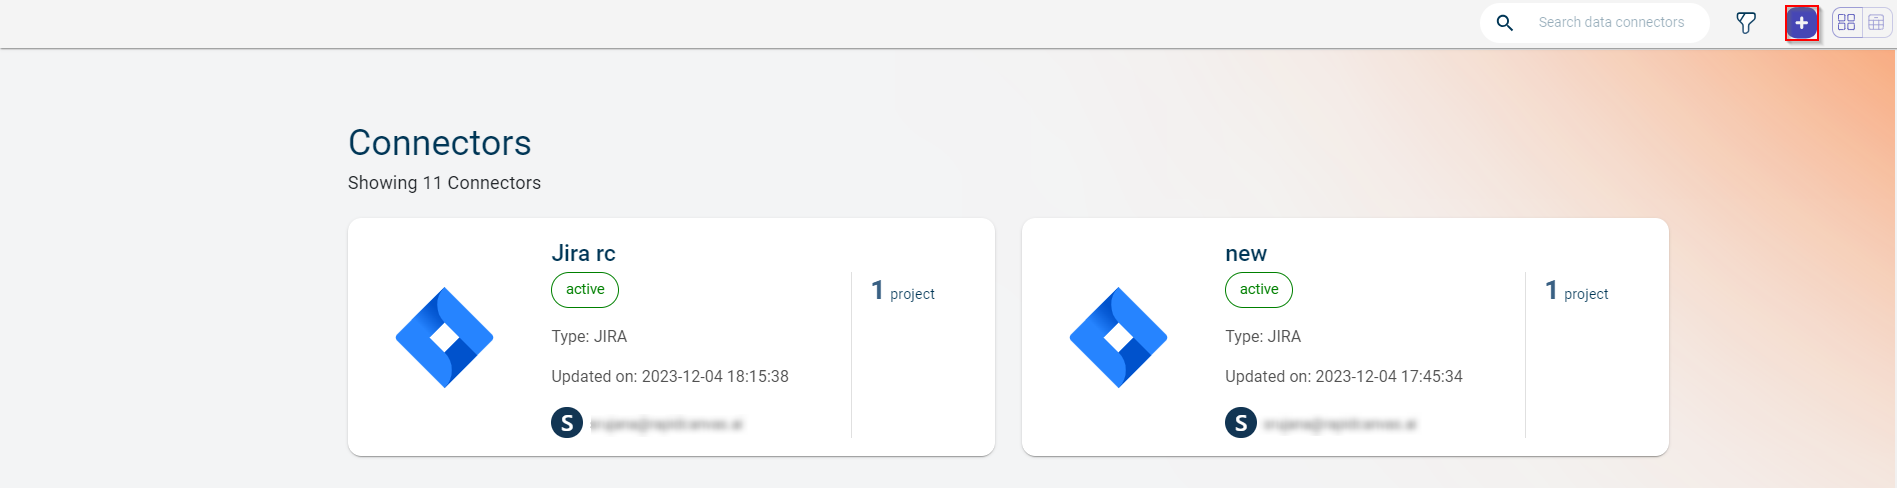
 and select Connectors. The Connectors page is displayed showing the total number of connectors.
The Data Connectors screen is displayed.
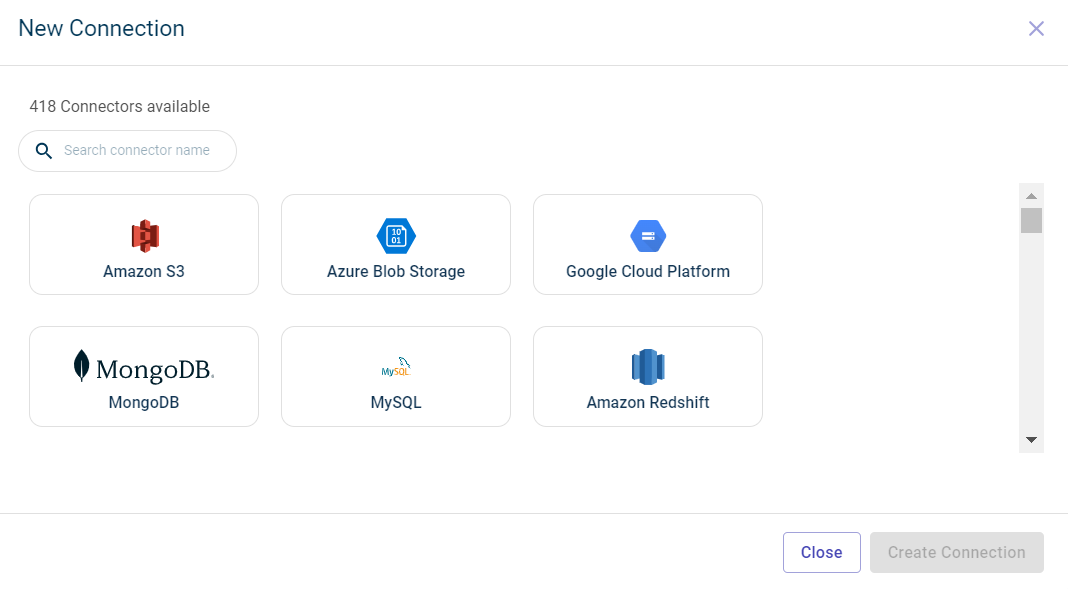
Click the plus icon
 on the top. You can also use the +New data connector button on the workspace to create a new connection. The later option appears only when there are no data connectors in the workspace.
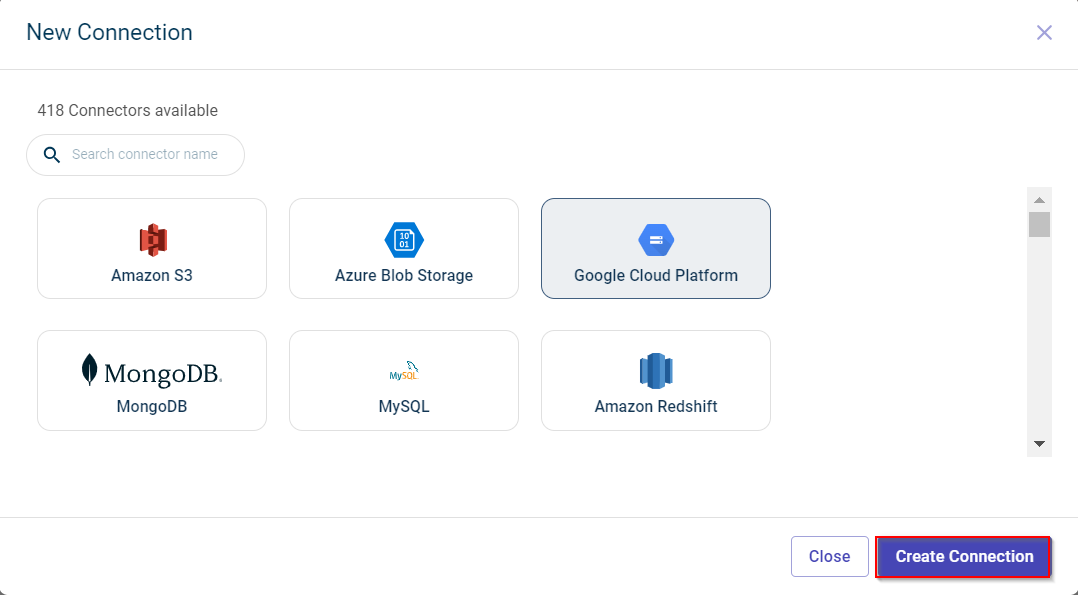
Click the Google Cloud services tile.
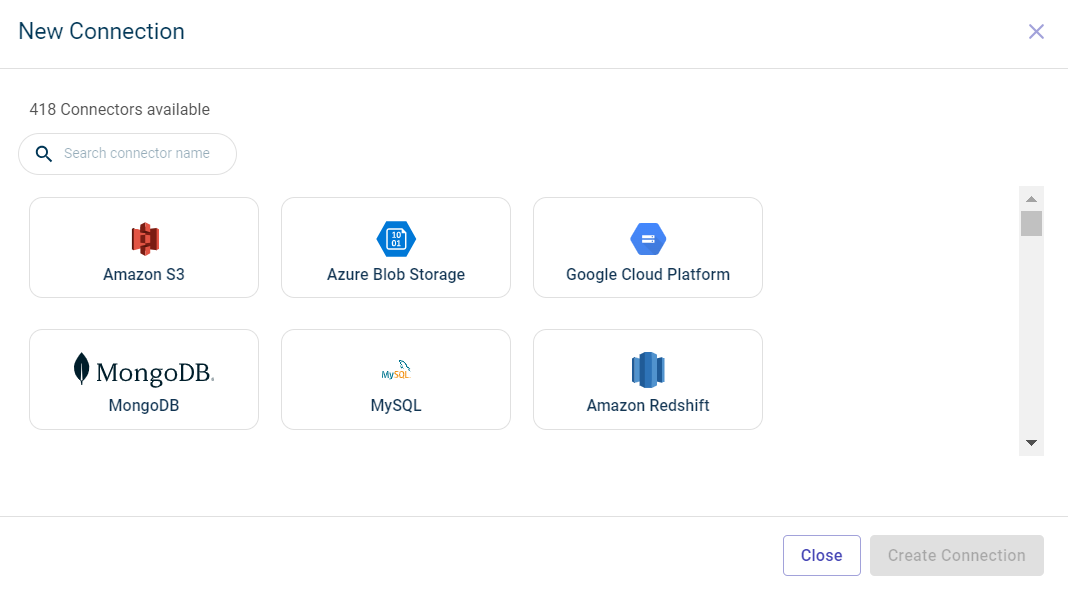
Click Create Connection. The Data connectors configuration page is displayed.
Specify this information to configure the Google cloud storage Data connector and access files:
- Name:
The name of the Data connector.
- Bucket:
The name of the bucket in which folders or files are stored in GCS. The bucket name used must be same as the name with which the bucket is created in the Google cloud storage.
- Access key:
The valid JSON access key generated after creating a service account in GCS, to authenticate.
Click the Test icon to check if you are able to establish the connection to the Data connector successfully. Once the connection is established, you can see the files imported from the GCS bucket to the platform. The list of files imported are populated in the table format. You can only view the file names, but cannot view or download.
Click Save to save the Data connector.
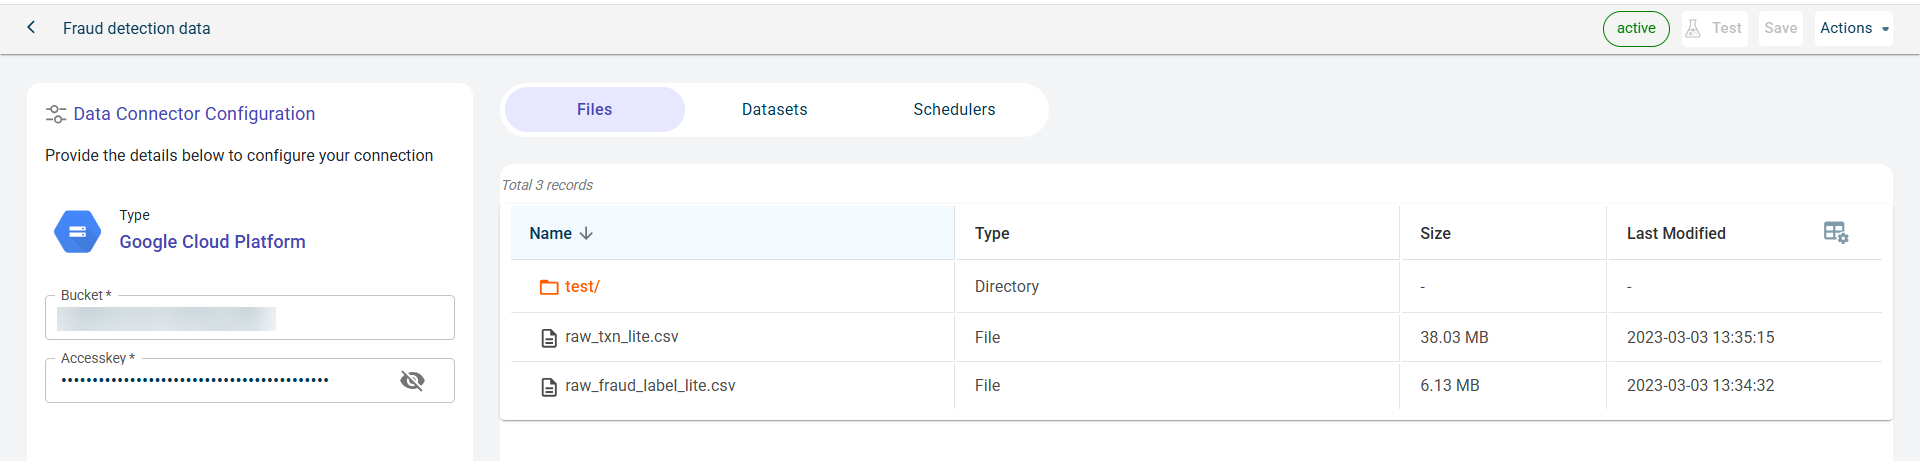
You can manage files, datasets, and published outputs for this data connector across different tabs:
Files Tab: View the files retrieved from this data connector.
Datasets Tab: See the projects where datasets fetched from this data connector have been used.
Schedulers Tab: View the outputs published to this connector. When creating a job, users can configure an external connector as the destination to publish the generated outputs upon job execution.
To delete the data connector, click the Actions drop-down menu and select Delete
This Data connector gets added to the already existing Data connectors on this workspace. You can use imported files from GCS in the drop-down list of data connectors while uploading a dataset on the canvas.
Importing data from Amazon S3
You can import data from Amazon S3 cloud storage to the RapidCanvas platform. For this, you must establish a connection with Amazon S3 by providing the bucket name, Access key ID and secret access key. Once the connection is established successfully, it provides access to the bucket from where you can import the data to the platform.
To import data from Amazon S3:
Hover over the menu icon
and select Connectors. The Connectors page is displayed showing the total number of connectors.
The Data connectors screen is displayed.
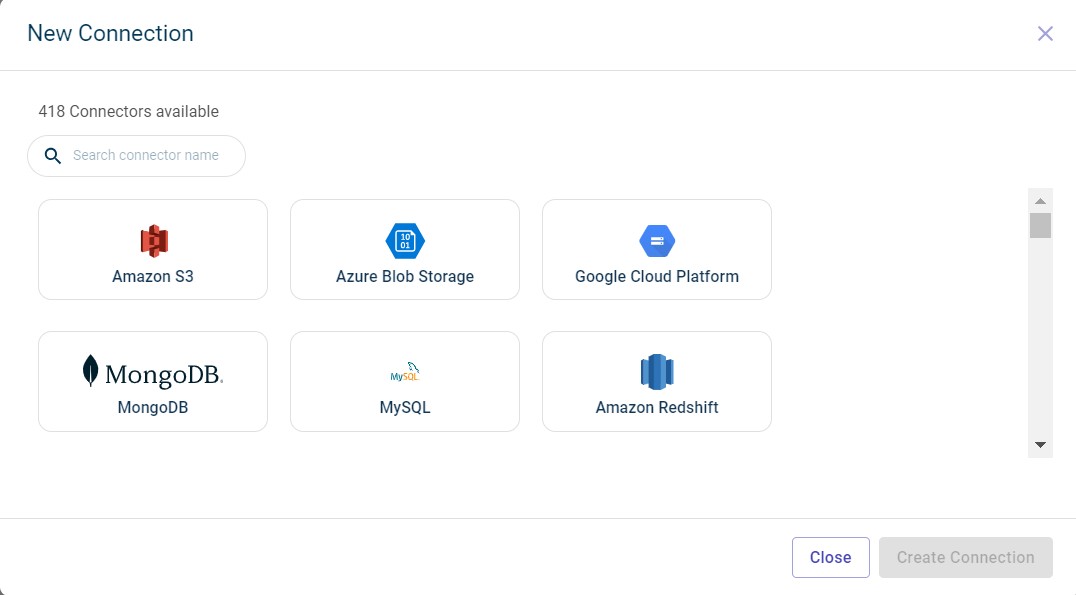
Click the plus icon
on the top. You can also use the +New data connector button on the workspace to create a new connection.
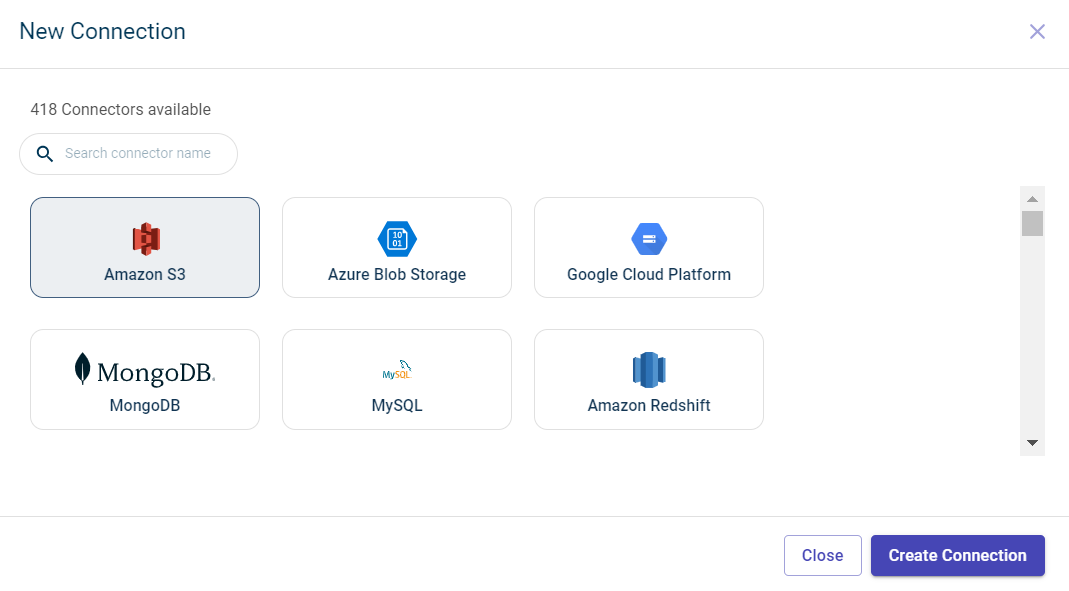
Click the Amazon S3 tile.
Click Create Connection. The Data connectors configuration page is displayed.
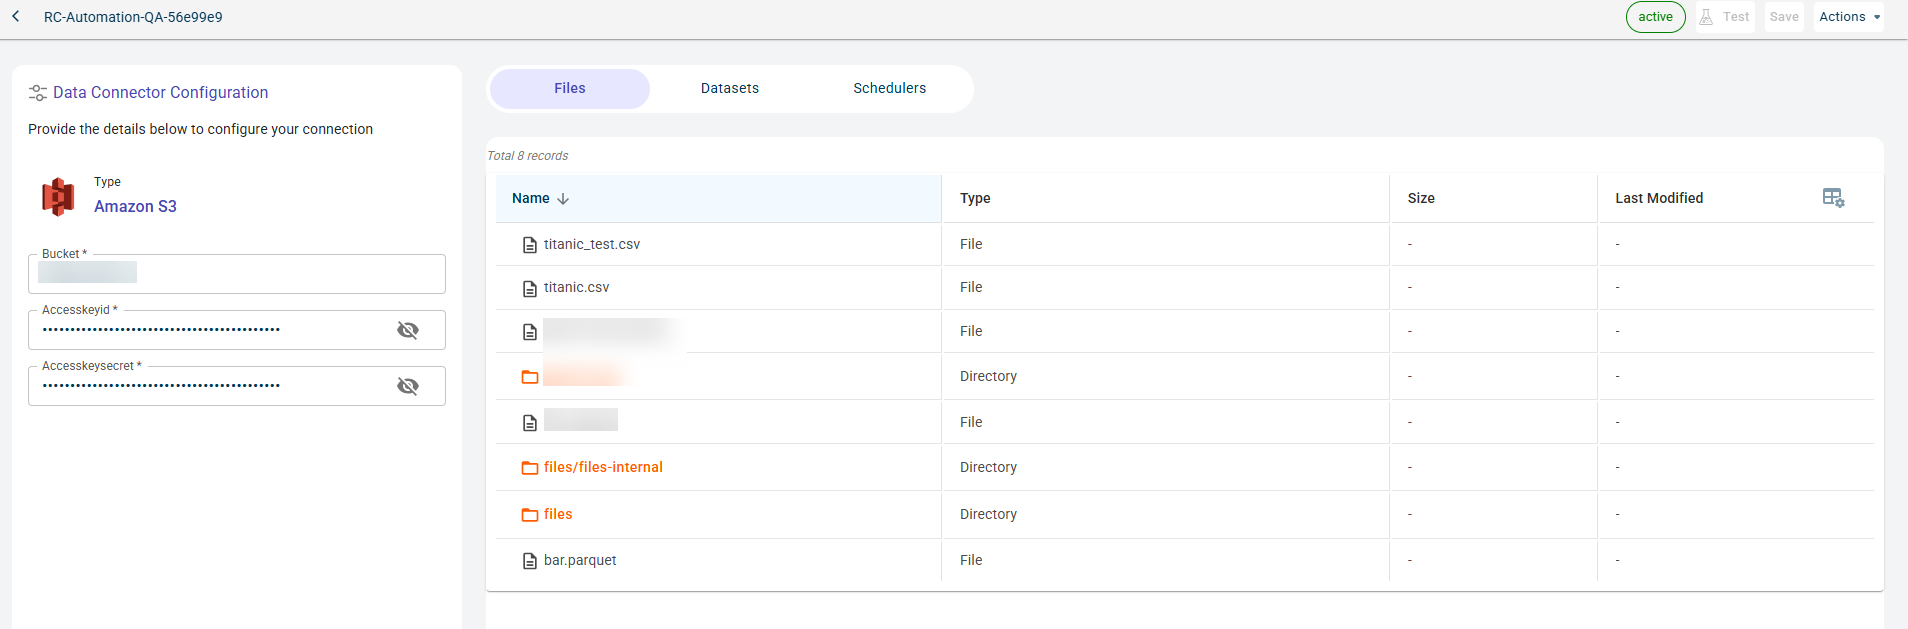
Specify this information to configure Amazon S3 Data connector and access folders and files stored inside the folder:
- Name:
The name of the Data connector.
- Bucket:
The name of the bucket in which folders or files are stored in GCS. The bucket name used must be same as the name with which the bucket is created in the S3.
- Access keyid:
The access key ID is like username to connect to the S3 bucket.
- Access key secret:
The access key secret is like password to connect to the S3 bucket.
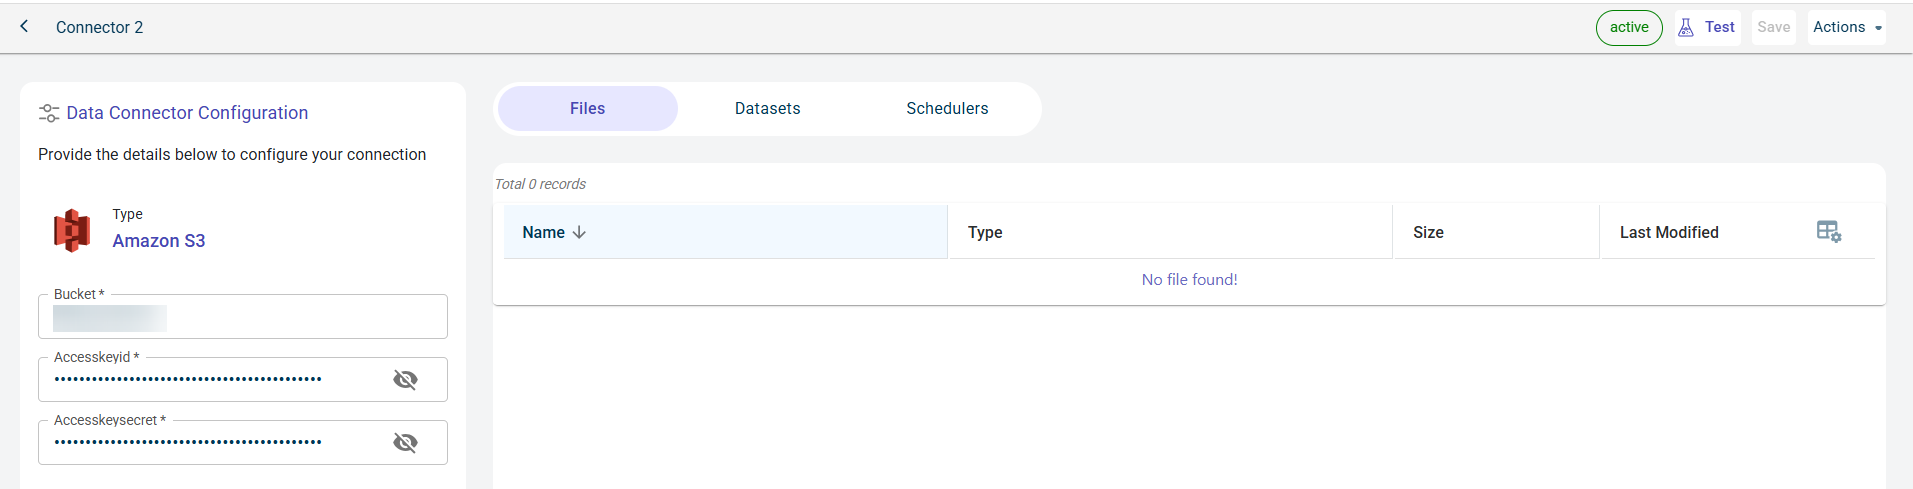
Click Test to check if you are able to establish the connection to the Data connector successfully. Once the connection is established, you can see the files imported from the S3 bucket to the platform. The list of files imported are populated in the table format.
Click Save to save the Data connector. This Data connector gets added to the already existing Data connectors on this workspace.
You can manage files, datasets, and published outputs for this data connector across different tabs:
Files Tab: View the files retrieved from this data connector.
Datasets Tab: See the projects where datasets fetched from this data connector have been used.
Schedulers Tab: View the outputs published to this connector. When creating a job, users can configure an external connector as the destination to publish the generated outputs upon job execution.
To delete the data connector, click the Actions drop-down menu and select Delete
Importing data from Azure Blob
You can import the data from Azure Blob to the RapidCanvas platform. For this, you must establish a connection with blob by providing the container name and connection string. After authenticating the request and establishing the connection successfully, you can have access to the resources in this container.
To import data from Azure Blob:
Hover over the menu icon
and select Connectors. The Connectors page is displayed showing the total number of connectors.
The Data connectors screen is displayed.
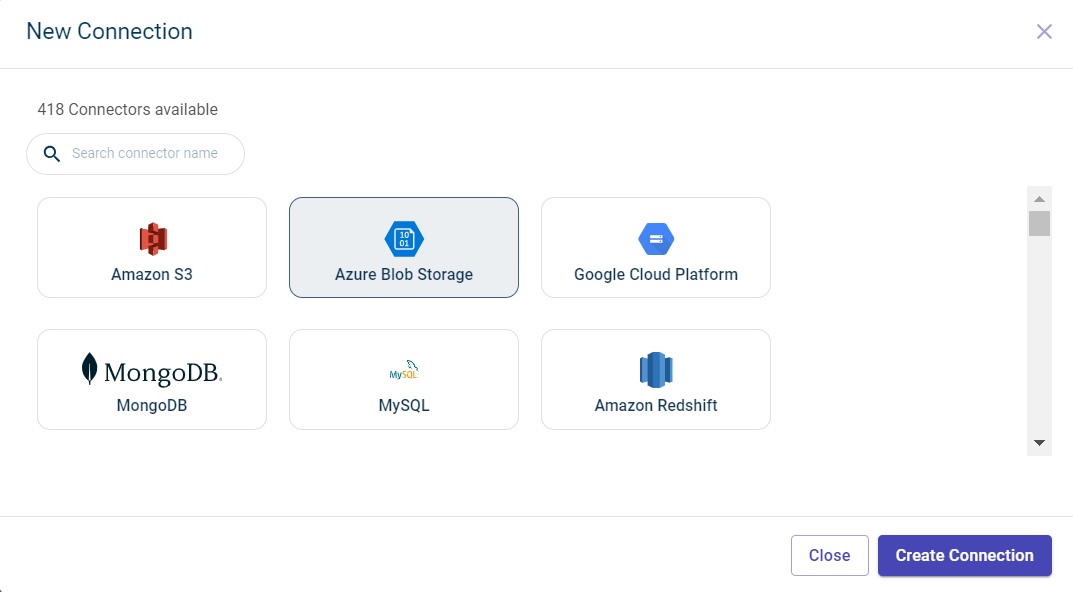
Click the plus icon
on the top. You can also use the +New data connector button on the workspace to create a new connection.
Click the Azure Blob tile.
Click Create Connection. The Data connectors configuration page is displayed.
Specify this information to configure Azure blob Data connector and access files stored in this Azure storage account:
- Name:
The name of the Data connector.
- Containername:
The name of the container in which the data is stored.
- Connectstr:
The connection string has authorization details for the platform to access the data stored in the Azure storage account.
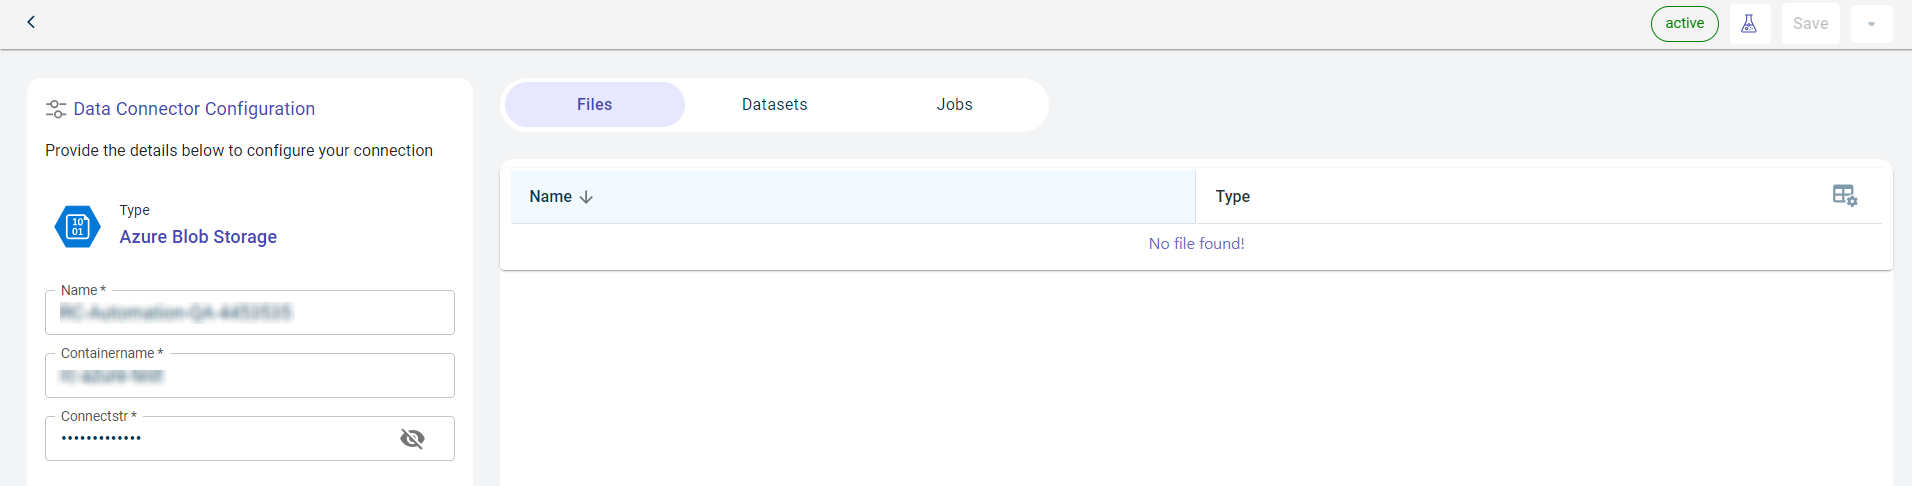
Click Test to check if you are able to establish the connection to the Data connector successfully. Once the connection is established, you can see the files imported from the Azure blob to the platform. The list of files imported are populated in the table format.
Click Save to save the Data connector. This Data connector gets added to the already existing Data connectors on this workspace.
You can manage files, datasets, and published outputs for this data connector across different tabs:
Files Tab: View the files retrieved from this data connector.
Datasets Tab: See the projects where datasets fetched from this data connector have been used.
Schedulers Tab: View the outputs published to this connector. When creating a job, users can configure an external connector as the destination to publish the generated outputs upon job execution.
To delete the data connector, click the Actions drop-down menu and select Delete.
This Data connector gets added to the already existing Data connectors on this workspace.
Importing data from Mongo DB
You can import the datasets from MongoDB to the RapidCanvas platform. For this, you must establish a connection with to the Mongo DB cluster by providing the connection string. After establishing the connection successfully, you can select the required data from the collection.
To import data from Mongo DB:
Hover over the menu icon
and select Connectors. The Connectors page is displayed showing the total number of connectors.
The Data connectors screen is displayed.
Click the plus icon
on the top. You can also use the +New data connector button on the workspace to create a new connection.
Click the MongoDB tile.
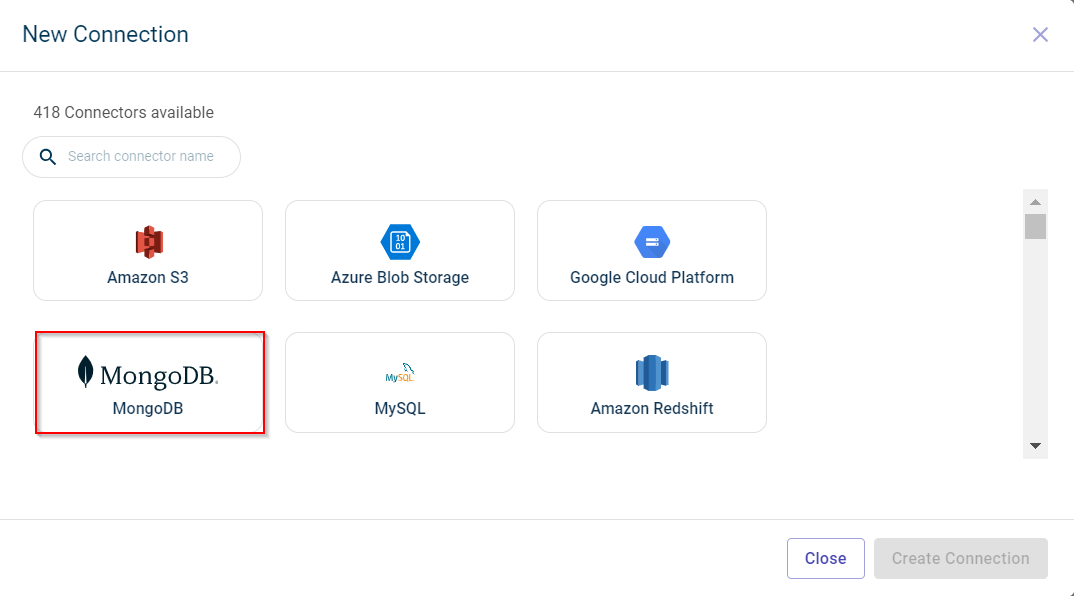
Click Create Connection. The Data connectors configuration page is displayed.
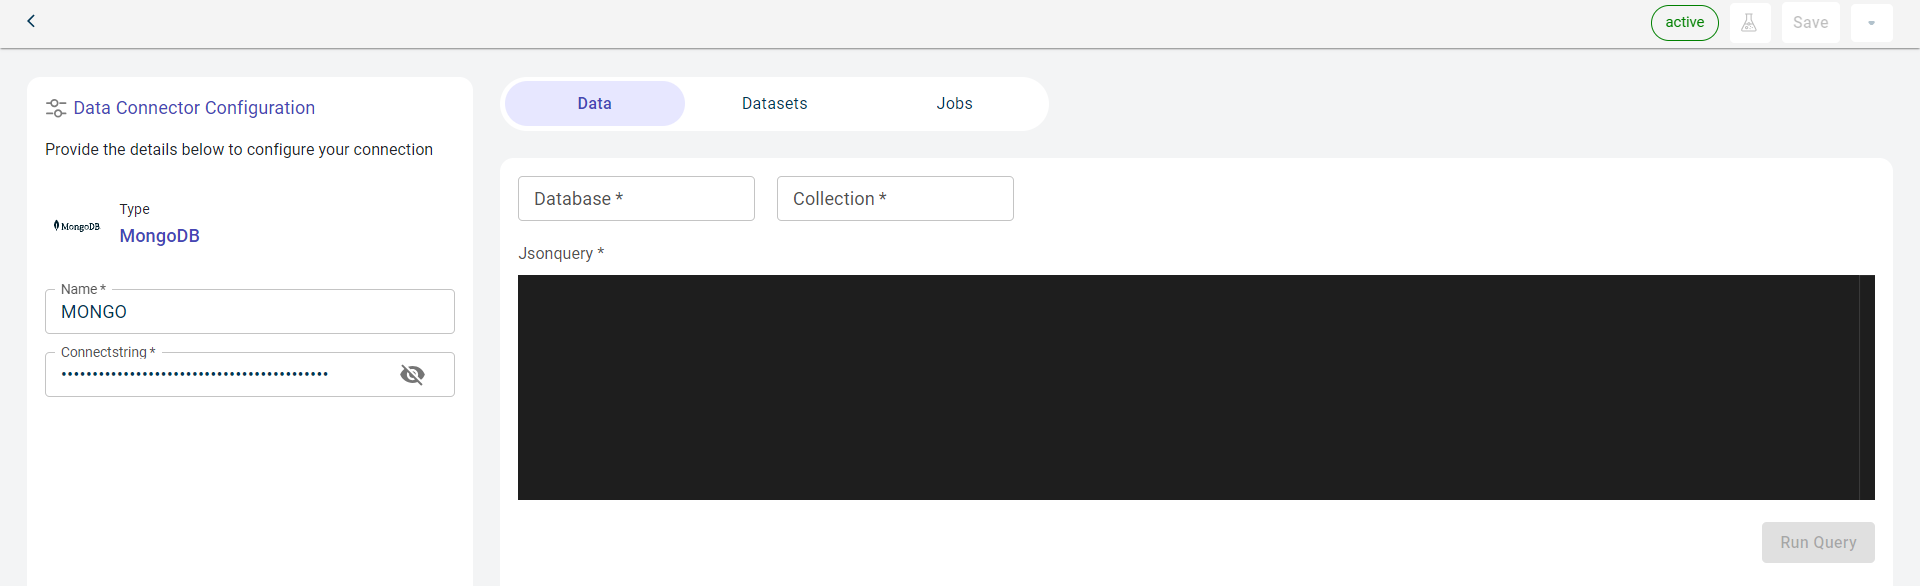
Specify this information to configure MongoDB Data connector and fetch files from in this database:
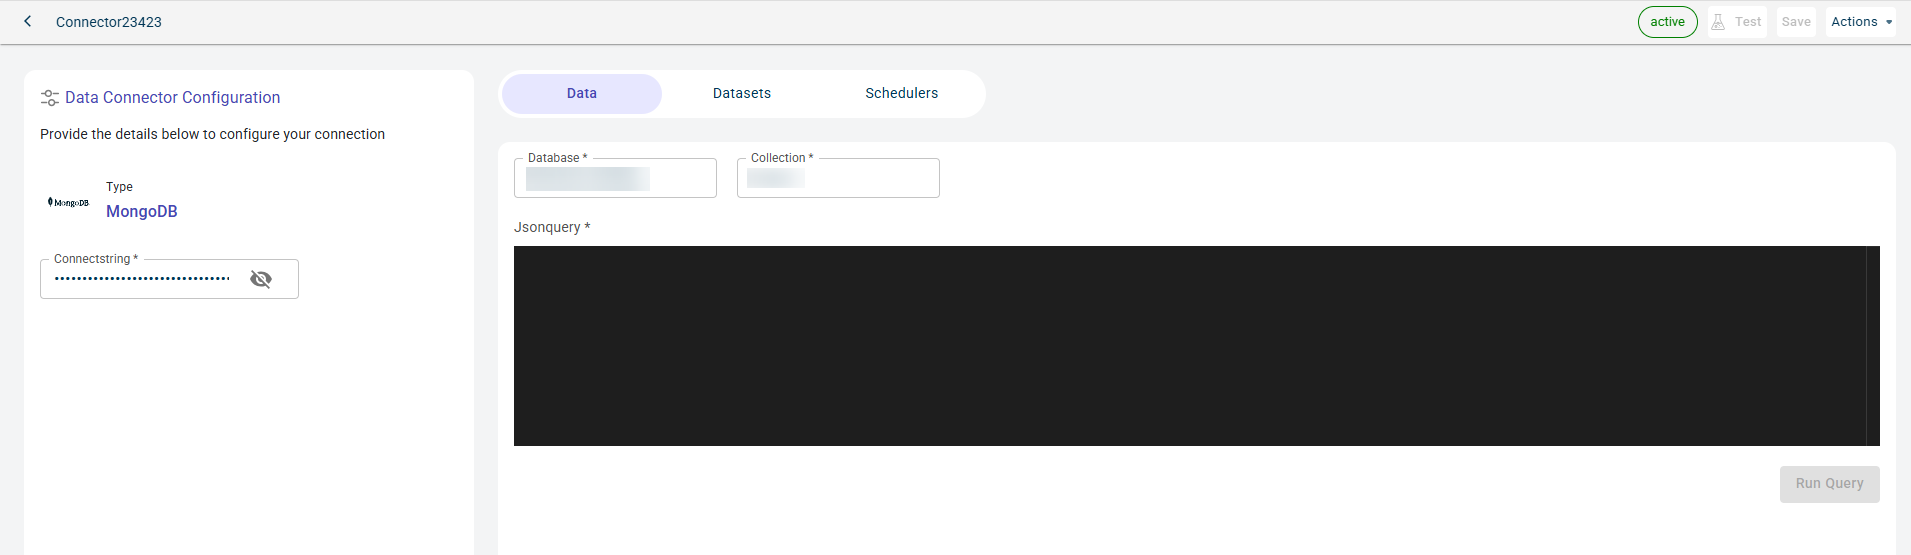
- Name:
The name of the data connector.
- Connectstring:
The connection string has authorization details for the platform to access the data stored in the MongoDB storage account.
Click Test to check if you are able to establish the connection to the Data connector successfully.
Click Save to save the database details.
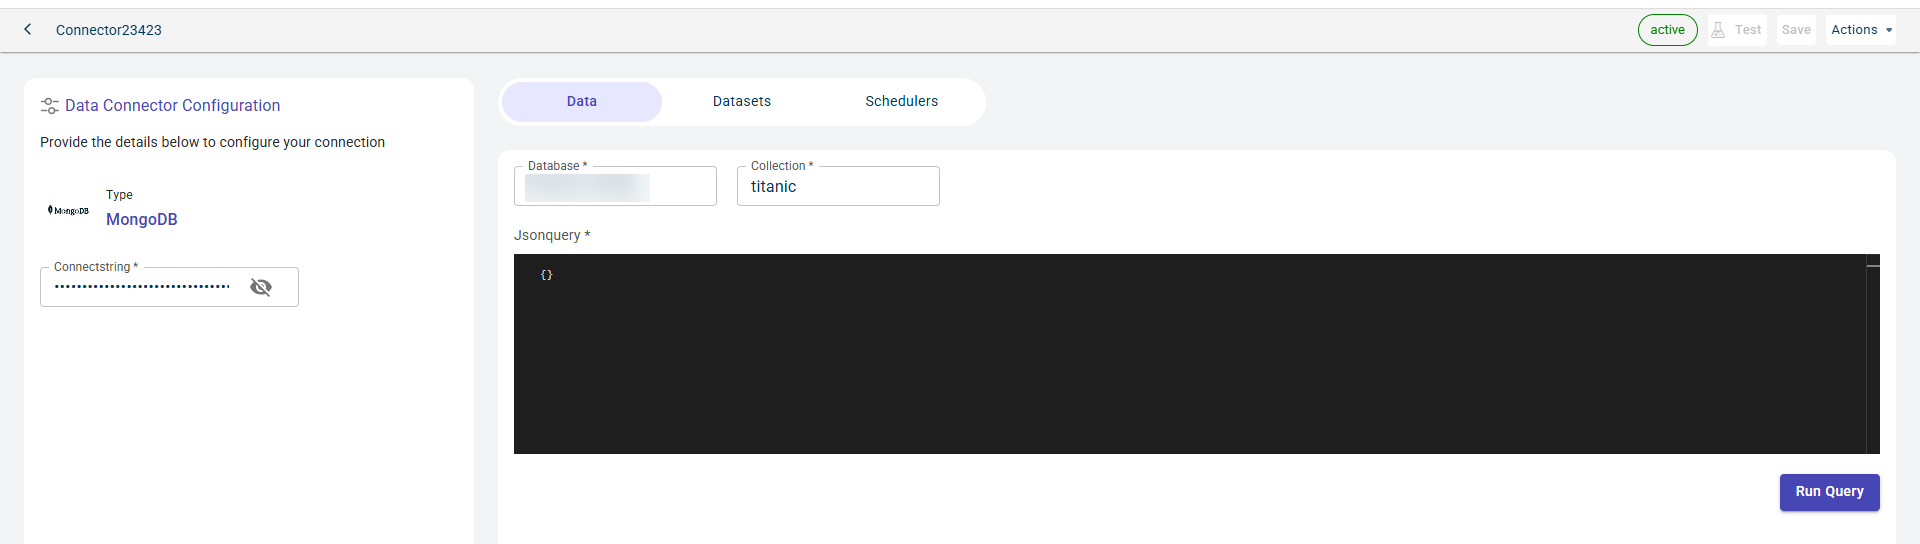
Specify this information on the Data tab:
- Database:
The name of the database where the data is stored.
- Collection:
The collection in the database you want to access.
- Jsonquery:
The JSON query you have to pass to fetch the information.
Click RUN QUERY to run this query and fetch the data from the database.
Once the connection is established, you can see the data imported from the MongoDB to the platform in the table format.
Click Save to save the Data connector. This Data connector gets added to the already existing Data connectors on this workspace.
You can manage files, datasets, and published outputs for this data connector across different tabs:
Data Tab: View the files retrieved from this data connector.
Datasets Tab: See the projects where datasets fetched from this data connector have been used.
Schedulers Tab: View the outputs published to this connector. When creating a job, users can configure an external connector as the destination to publish the generated outputs upon job execution.
Importing data from Snowflake
You can import the datasets from Snowflake to the RapidCanvas platform. For this, you must establish a connection with to Snowflake by providing the account details. After establishing the connection successfully, you can select the warehouse and database from where you want to fetch the datasets.
To import data from Snowflake:
Hover over the menu icon
and select Connectors. The Connectors page is displayed showing the total number of connectors.
The Data connectors screen is displayed.
Click the plus icon
on the top. You can also use the +New data connector button on the workspace to create a new connection.
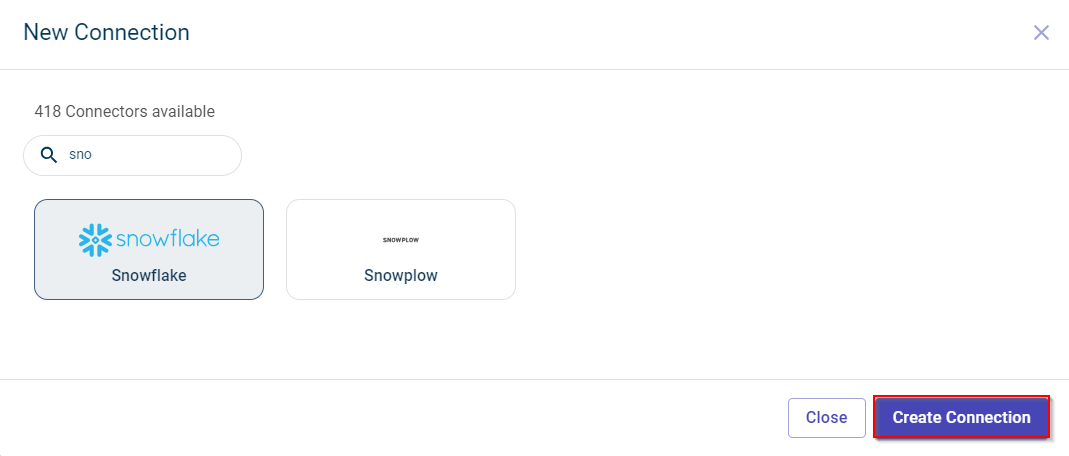
Click the Snowflake tile.
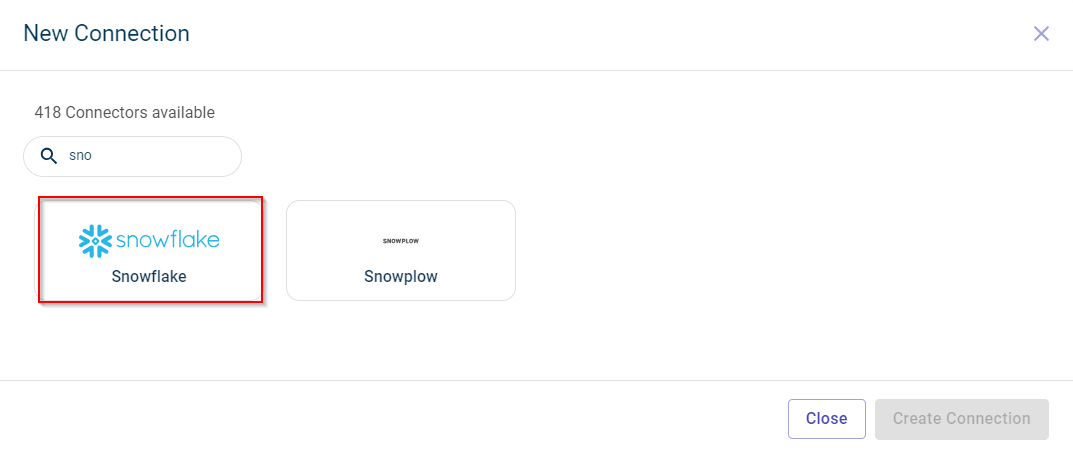
Click Create Connection. The Data connectors configuration page is displayed.
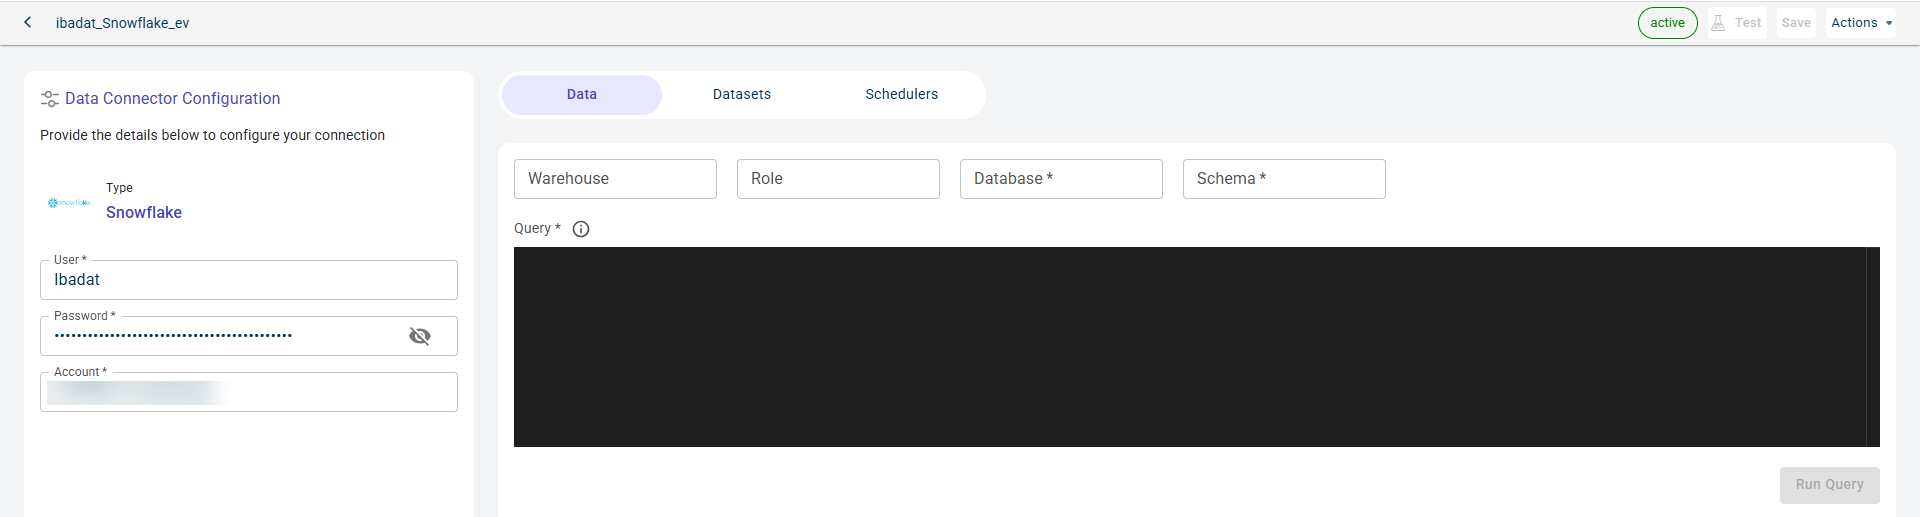
Specify this information to configure Snowflake Data connector and access files stored in this Snowflake account:
- Name:
The name of the Data connector.
- User:
The name of the user account.
- Password:
The password for the user account.
- Account:
The name of the account.
Click Test to check if you are able to establish the connection to the Data connector successfully.
Click Save to save the database details. The Data tab fields are enabled only after saving the connector details.
Specify this information on the Data tab. The fields on this tab are enabled only after you establish connected with the Data connector.
- Warehouse:
The warehouse to which you have to connect.
- Role:
The permission assigned to the user.
- Database:
The name of the database to use.
- Schema:
The schema of the file.
- Jsonquery:
The JSON query you have to provide in the terminal to fetch the data you want.
Click RUN QUERY to run this query and fetch the data from the database.
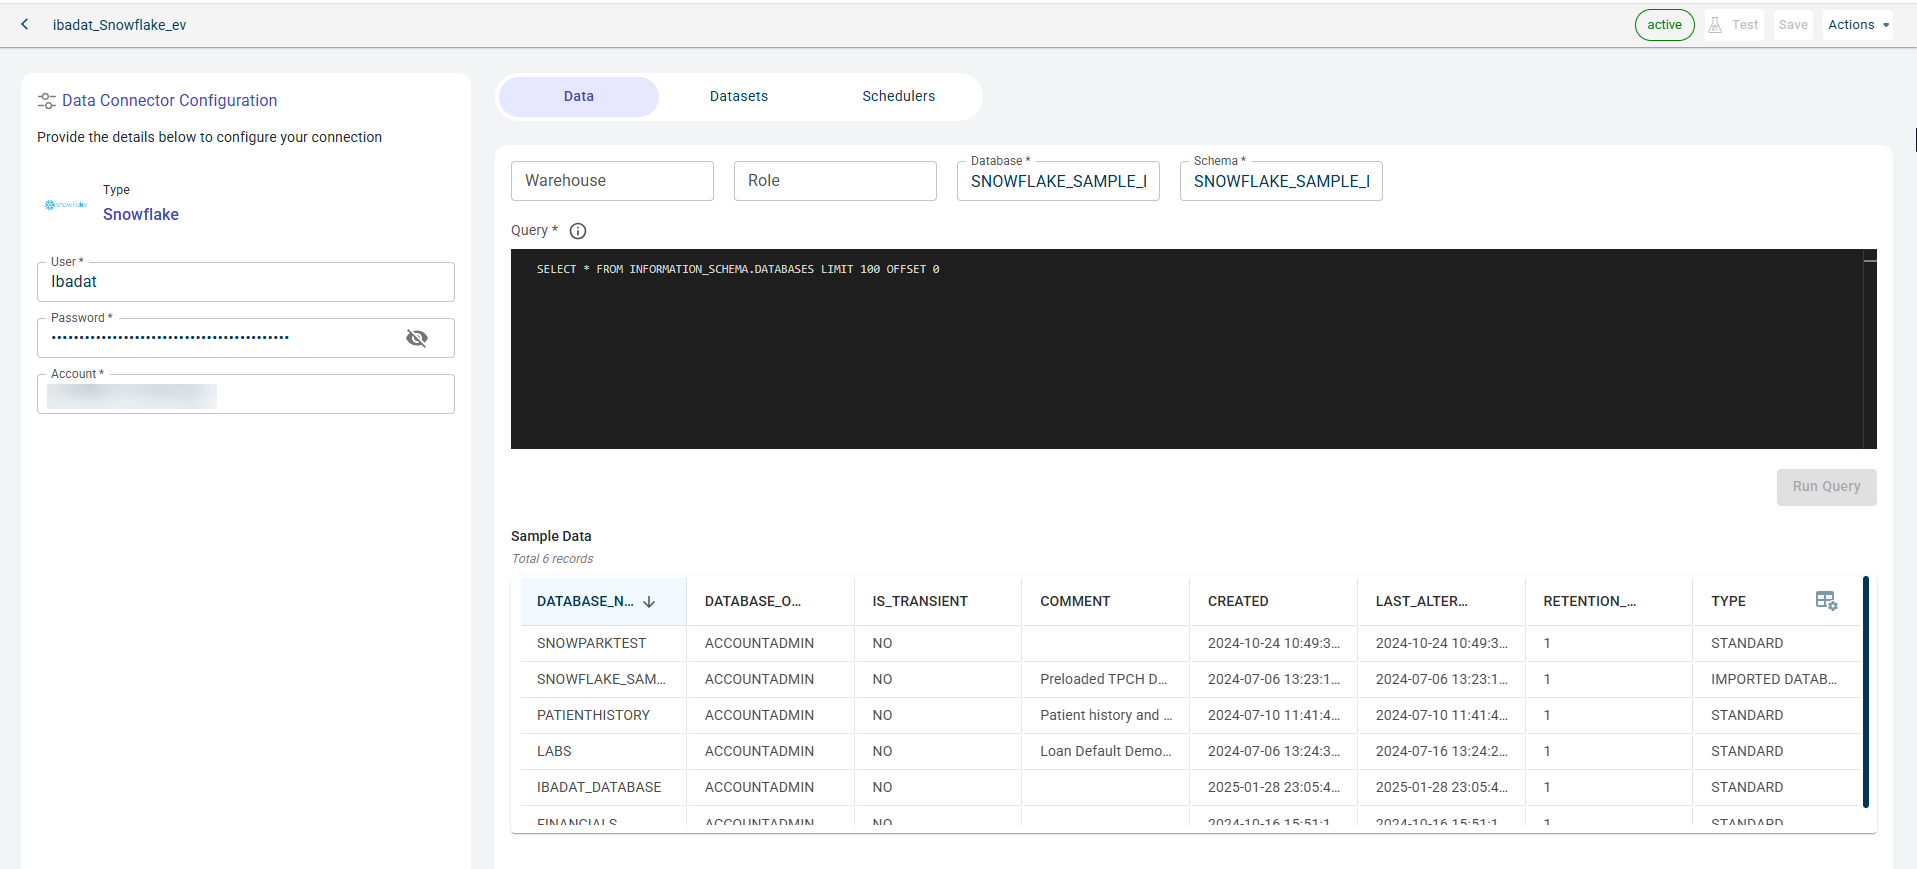
Once the connection is established, you can see the data imported from the Snowflake to the platform in the table format.
You can manage files, datasets, and published outputs for this data connector across different tabs:
Data Tab: View the files retrieved from this data connector.
Datasets Tab: See the projects where datasets fetched from this data connector have been used.
Schedulers Tab: View the outputs published to this connector. When creating a job, users can configure an external connector as the destination to publish the generated outputs upon job execution.
Importing data from MySQL
You can import the data from MySQL to the RapidCanvas platform. For this, you must establish a connection with MySQL database by providing the connect string. After establishing the connection successfully, you can query the database to fetch the data.
To import data from Snowflake:
Hover over menu icon
and select Connectors. The Connectors page is displayed showing the total number of connectors.
The Data connectors screen is displayed.
Click the plus icon
on the top. You can also use the +New data connector button on the workspace to create a new connection.
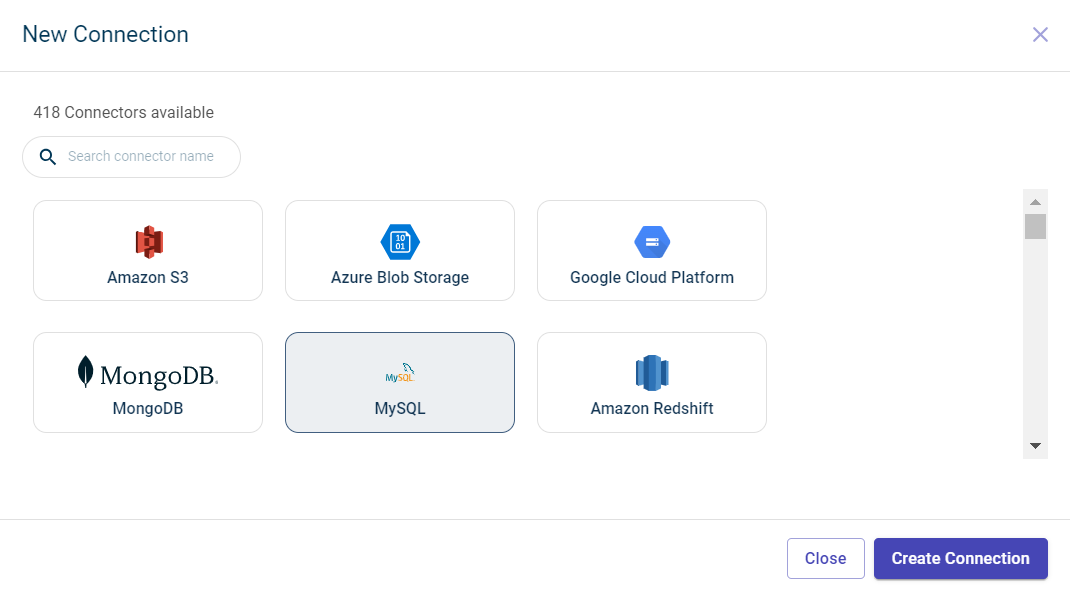
Click the MySQL tile.
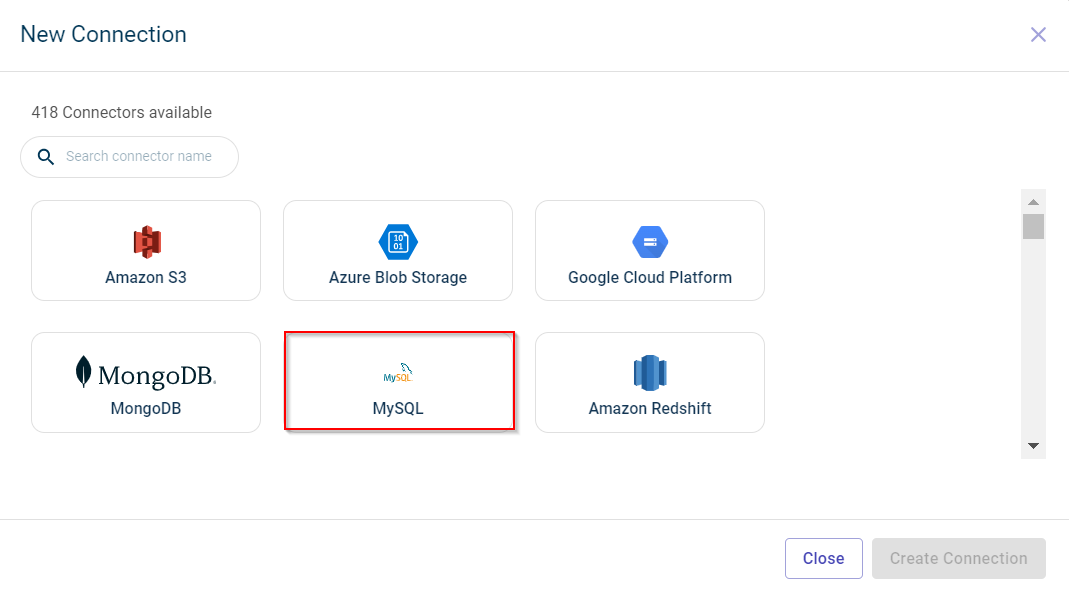
Click Create Connection. The Data connectors configuration page is displayed.
Specify this information to establish connection with MySQL database and access fetch the data in the table form by querying:
- Name:
The name of the Data connector.
- Connectstring:
The string to connect to the database.
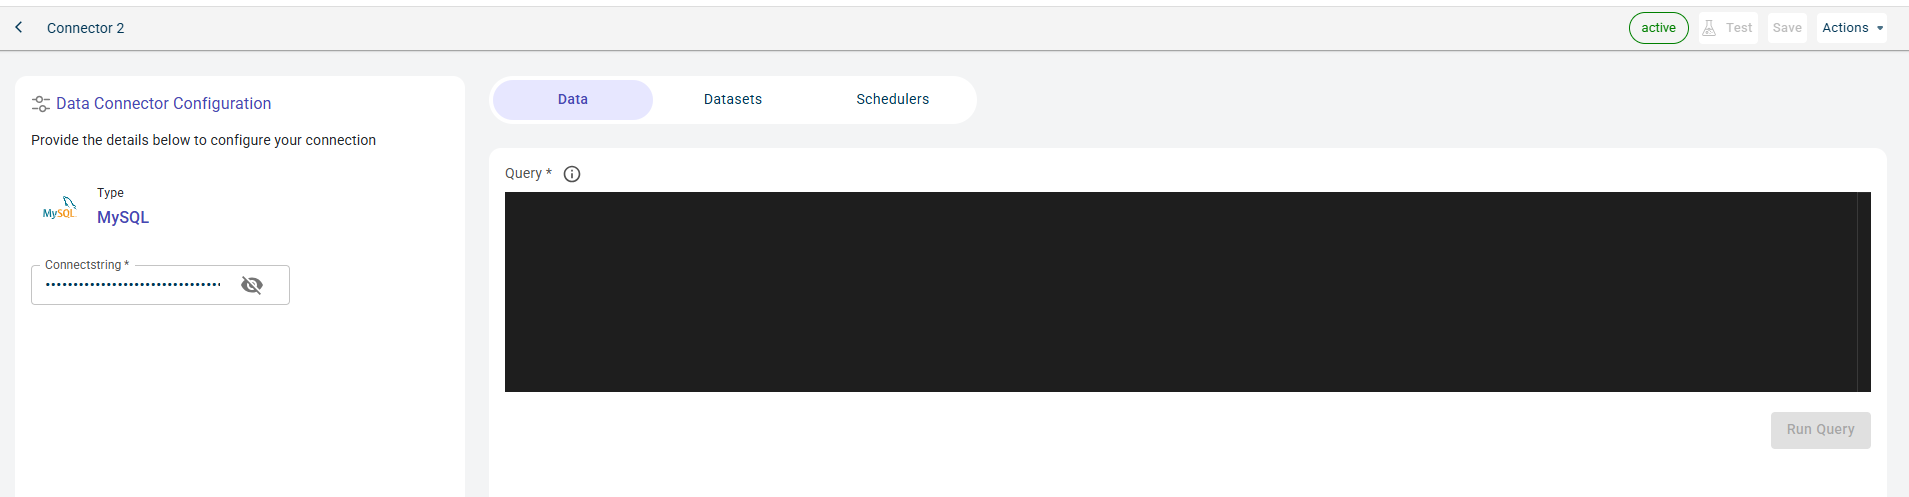
Click Test to check if you are able to establish the connection to the Data connector successfully.
Click Save to save the database details. You can only pass the query once the Data tab is enabled. This is enabled after successfully testing the connection.
Specify this information on the Data tab.
Provide the query in the terminal.
Click RUN QUERY to run this query and fetch the data from the database. This button is enabled after you enter the query.
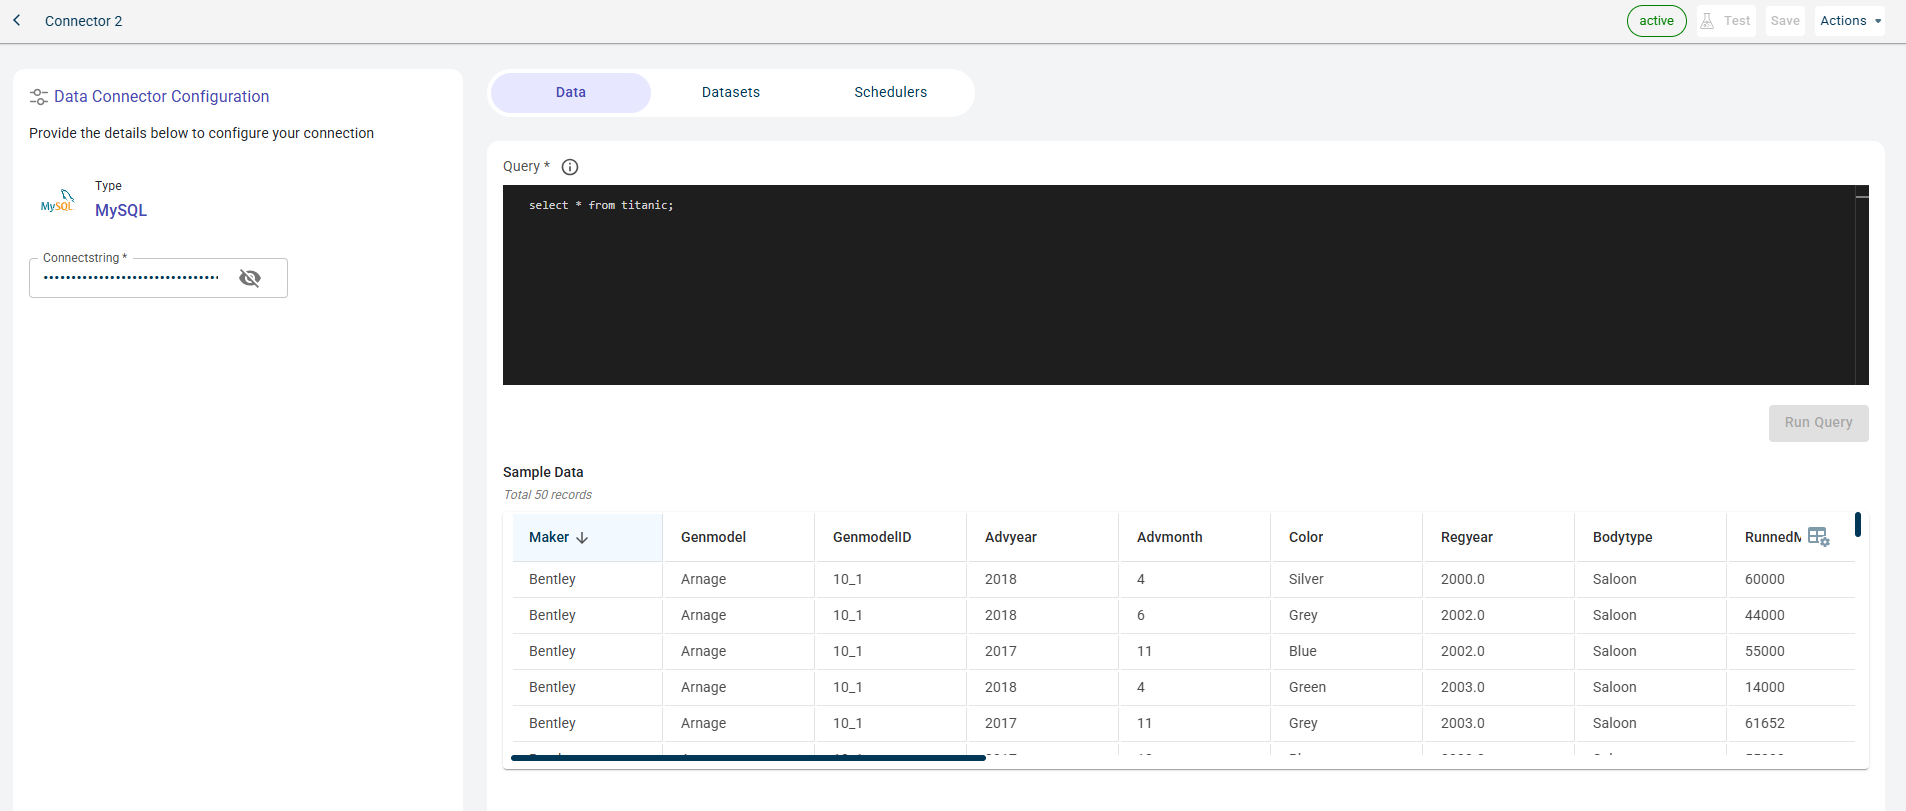
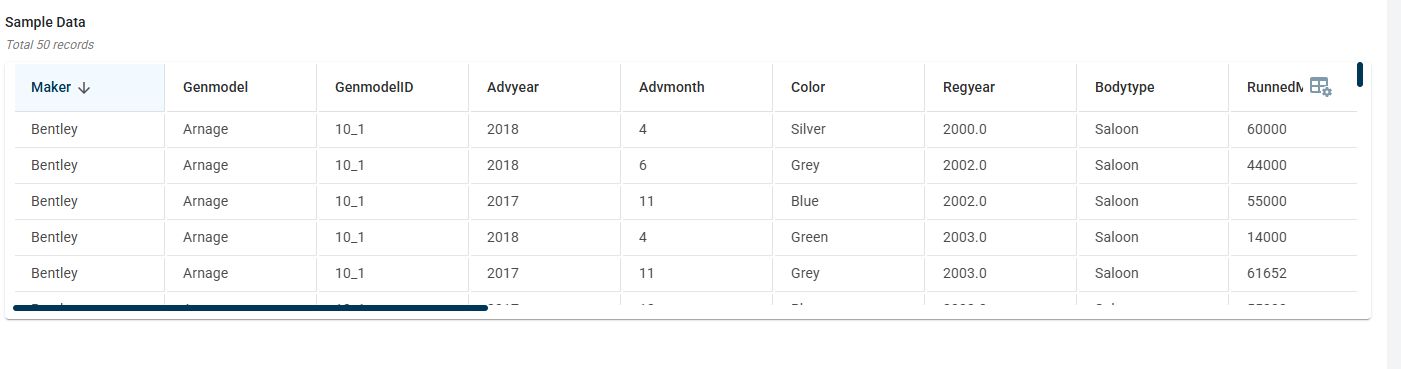
Once the connection is established, you can see the data imported from MySQL to the platform in the table format.
You can manage files, datasets, and published outputs for this data connector across different tabs:
Data Tab: View the dataset retrieved from this data connector.
Datasets Tab: See the projects where datasets fetched from this data connector have been used.
Schedulers Tab: View the outputs published to this connector. When creating a job, users can configure an external connector as the destination to publish the generated outputs upon job execution.
Importing data from Amazon Redshift
You can import the data from Amazon Redshift to the RapidCanvas platform. For this, you must establish a connection with this database by providing the connect string. After establishing the connection successfully, you can query the database to fetch the data from the available tables and load the data to the platform.
To import data from Amazon Redshift:
Hover over the menu icon
and select Connectors. The Connectors page is displayed showing the total number of connectors.
The Data connectors screen is displayed.
Click the plus icon
on the top. You can also use the +New data connector button on the workspace to create a new connection.
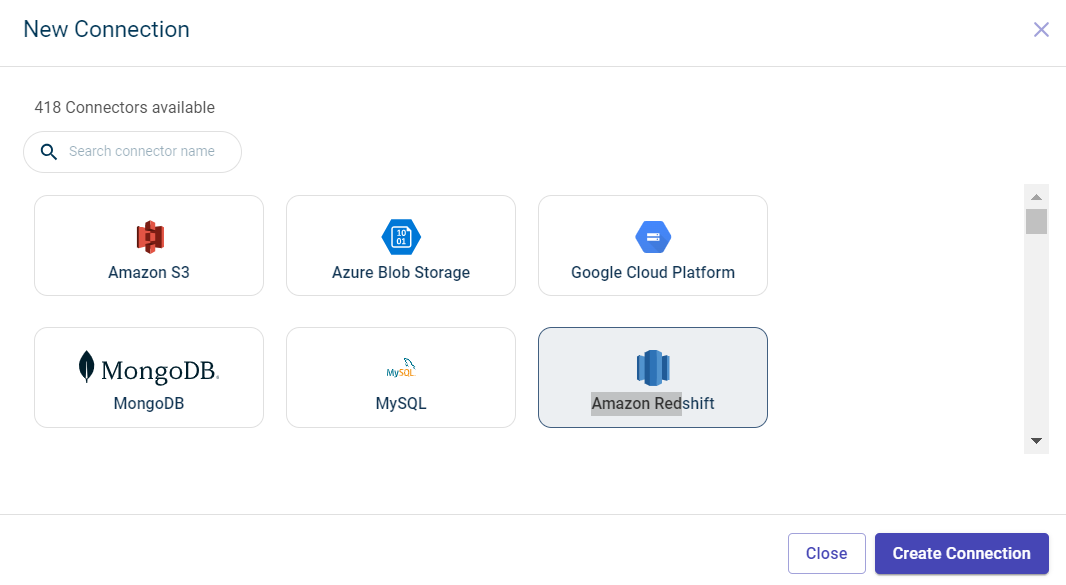
Click the Amazon RedShift tile.
Click Create Connection. The Data connectors configuration page is displayed.
Specify this information to establish connection with Amazon Redshift database and access fetch the data in the table form by querying:
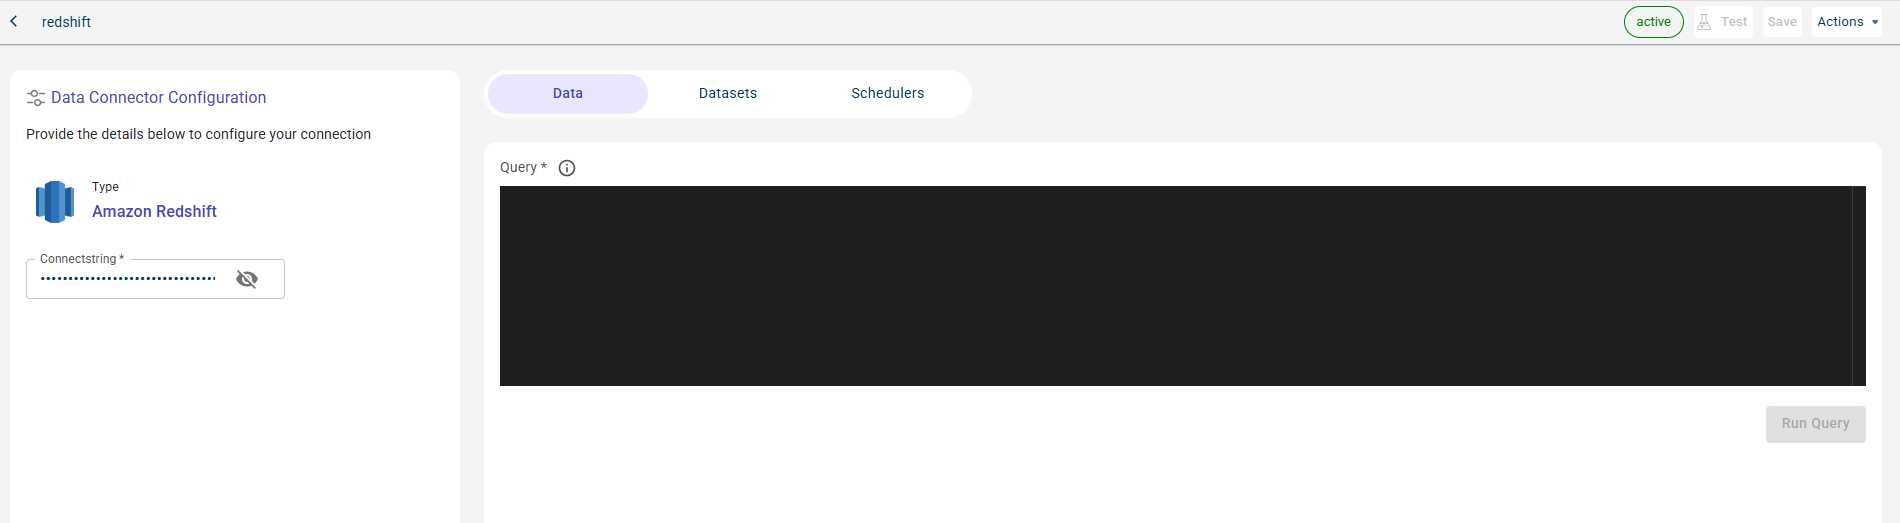
- Name:
The name of the Data connector.
- Connectstring:
The string to connect to the database.
Click Test to check if you are able to establish the connection to the Data connector successfully.
Click Save to save the database details. You can only pass the query once the Data tab is enabled. This is enabled after successfully testing the connection.
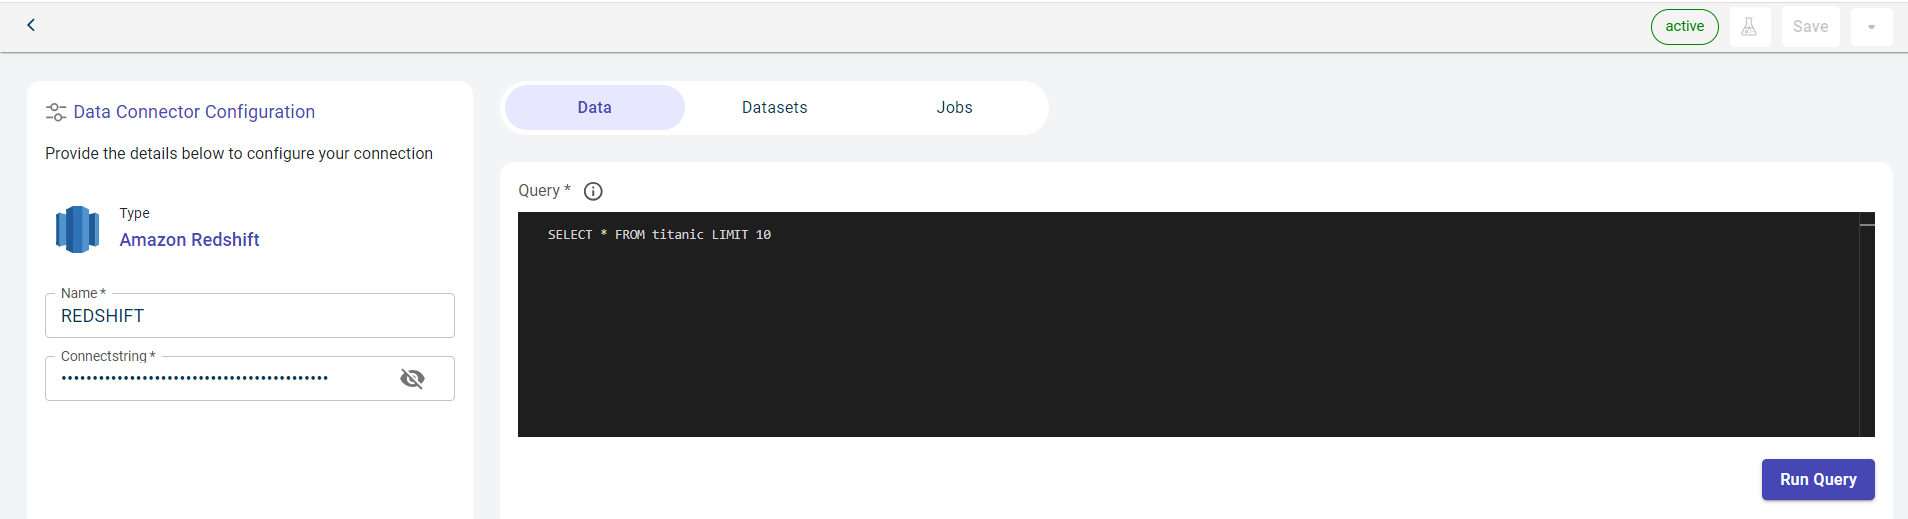
Specify this information on the Data tab.
Provide the query in the terminal.
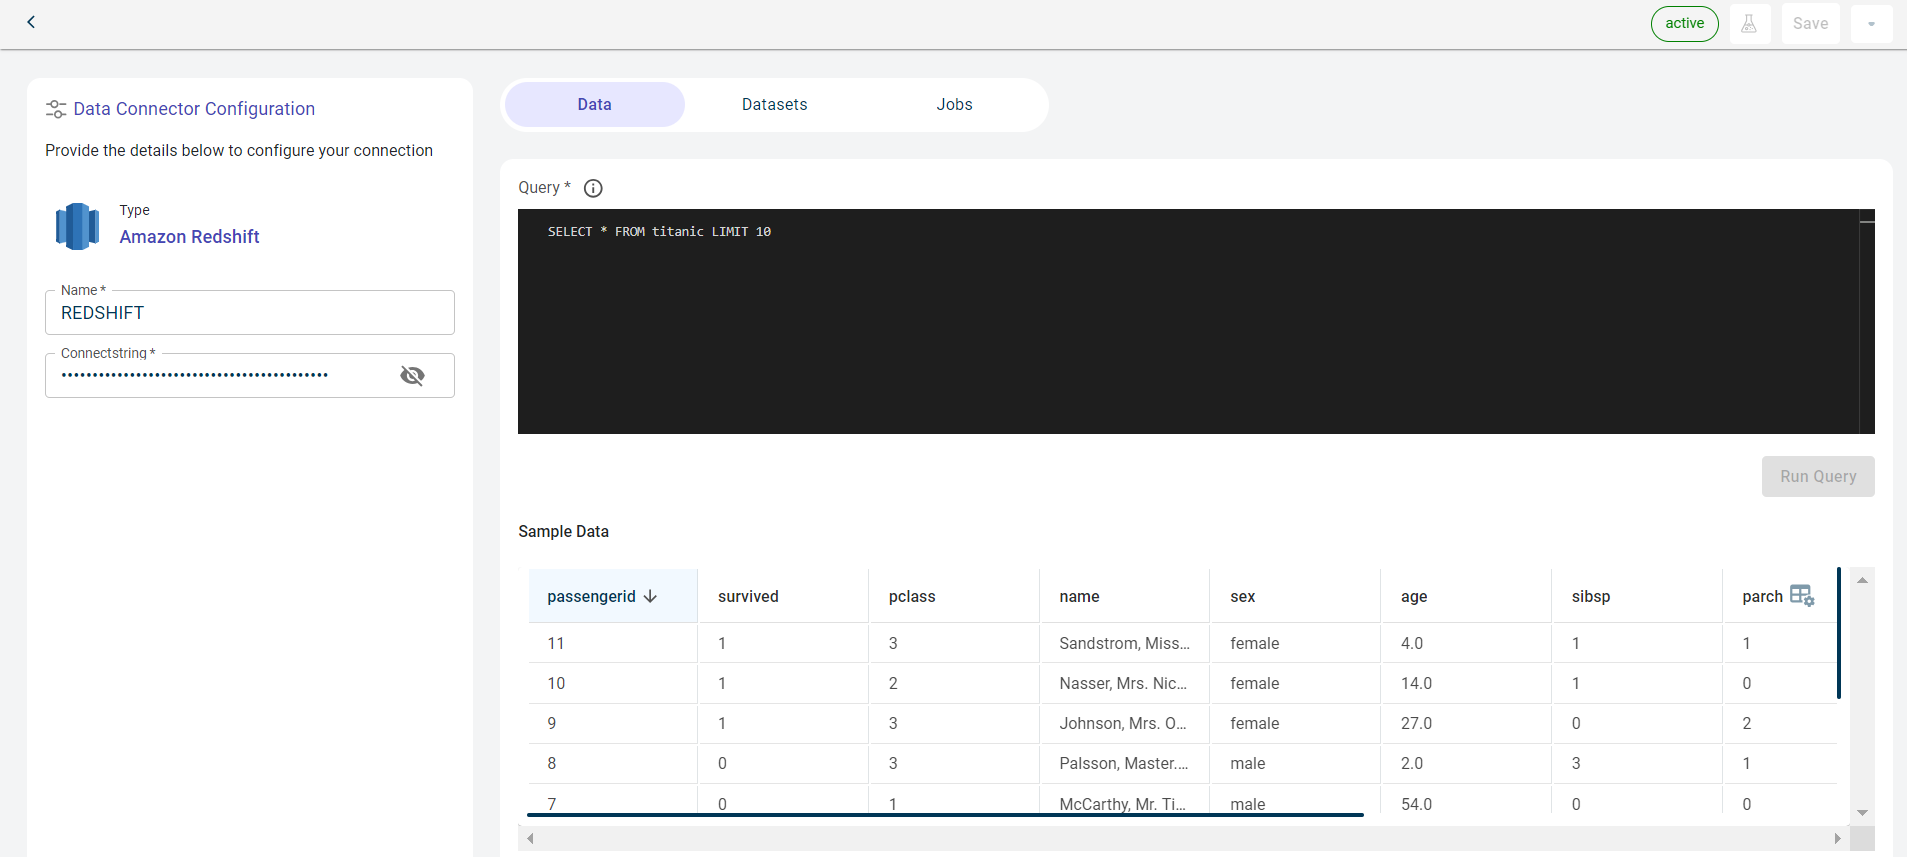
Click RUN QUERY to run this query and fetch the data from the database. This button is enabled after you enter the query.
Once the connection is established, you can see the data imported from Amazon Redshift to the platform in the table format.
Navigate to the Datasets tab to view the projects that are using the datasets fetched from this connector. You can see the datasets exported to this dataset after running the project at the scheduled time in the Data connector as destination section.
Click the Schedulers tab to view the jobs in which the connector has been configured as the destination.
You can manage files, datasets, and published outputs for this data connector across different tabs:
Data Tab: View the dataset retrieved from this data connector.
Datasets Tab: See the projects where datasets fetched from this data connector have been used.
Schedulers Tab: View the outputs published to this connector. When creating a job, users can configure an external connector as the destination to publish the generated outputs upon job execution.
Importing data from Fivetran connectors
Use this procedure to import data from Fivetran connectors. With 300+ connectors, we have explained how to import data from one of the Fivetran connectors, i.e. GoogleDrive.
To import data from Google Drive:
Hover over the menu icon
and select Connectors. The Connectors page is displayed showing the total number of connectors.
The Data connectors screen is displayed.
Click the plus icon
on the top. You can also use the +New data connector button on the workspace to create a new connection.
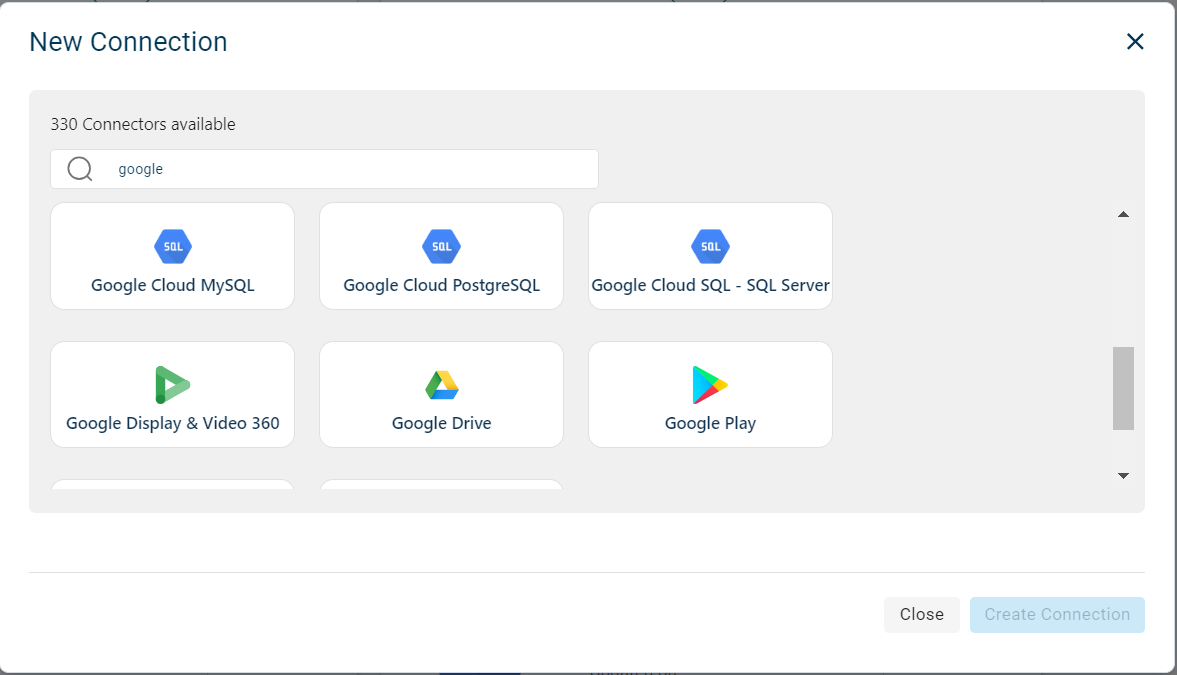
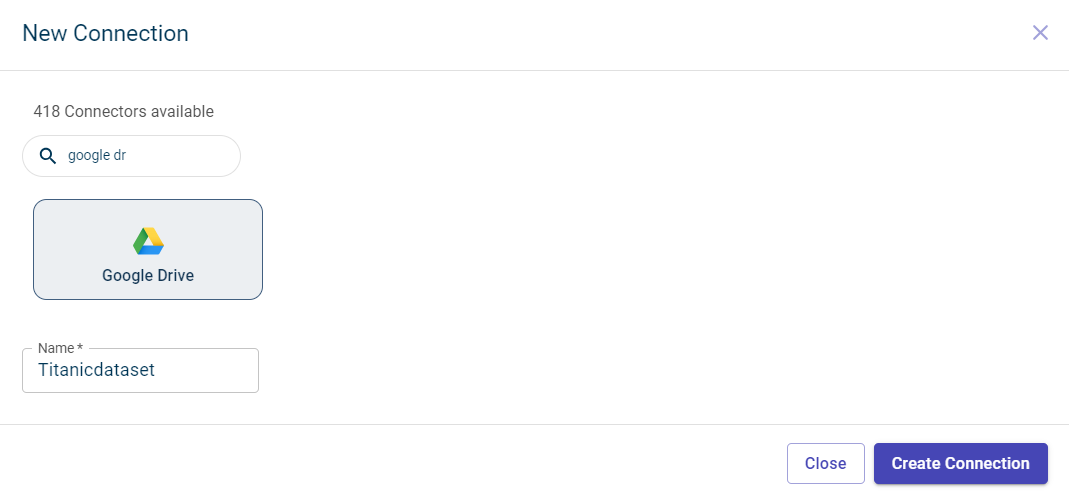
Select Google Drive. It is a Fivetran connector.
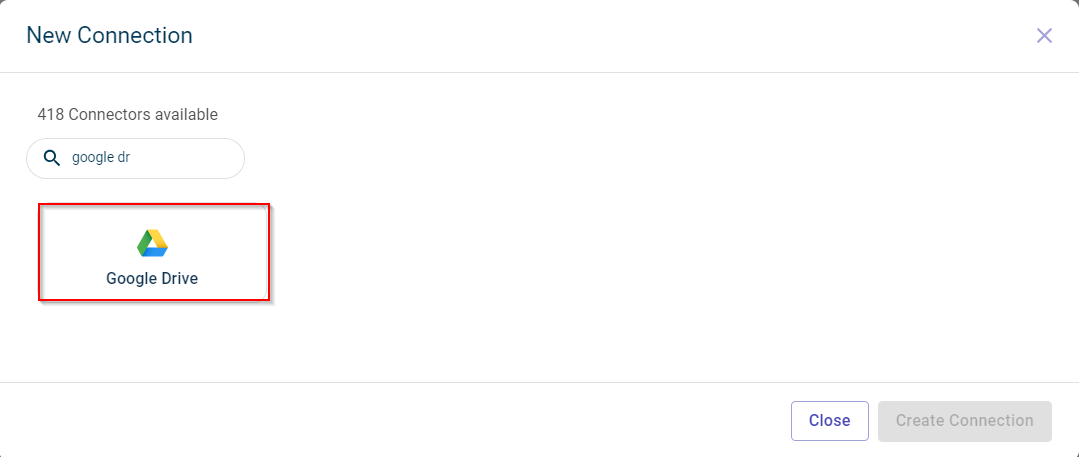
Enter the name of the connector.
Click Create Connection. This takes you to the fivetran page
Click Continue. This opens the page where you can provide the Google Drive details.
Click Copy corresponding to the FiveTran email field to copy this email.
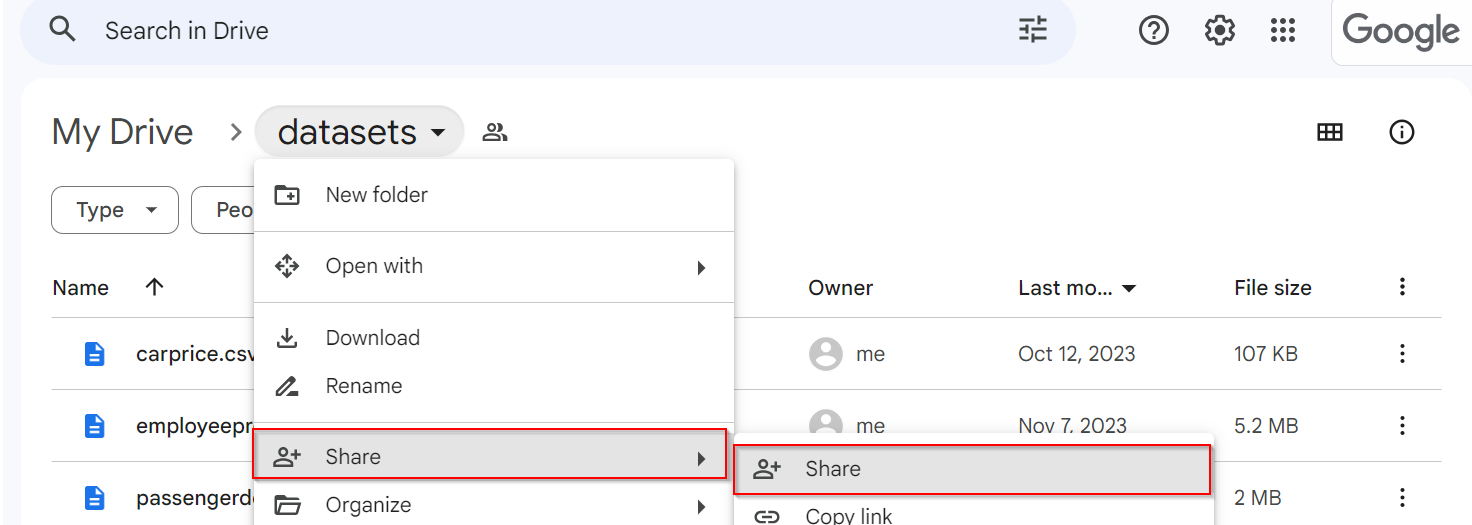
Navigate to your Google Drive and click the folder you want share and sync to the platform, and then click the Share option. You must provide editor access to this folder for all.
Copy the folder URL where the files on the Google Drive are stored.
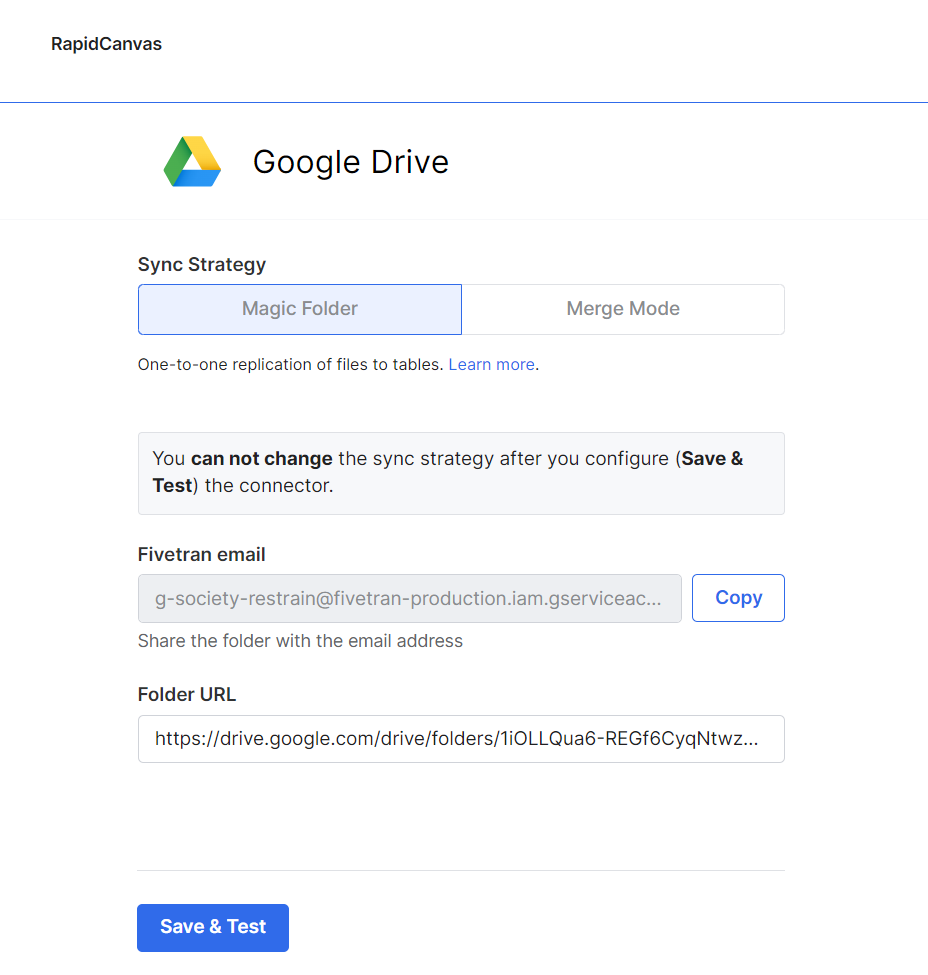
Click Save & Test to sync the datasets in Google drive to the platform. You can see the datasets that are syncing up.
Note
When the sync fails, you can use the manual sync option to restart the syncing process.
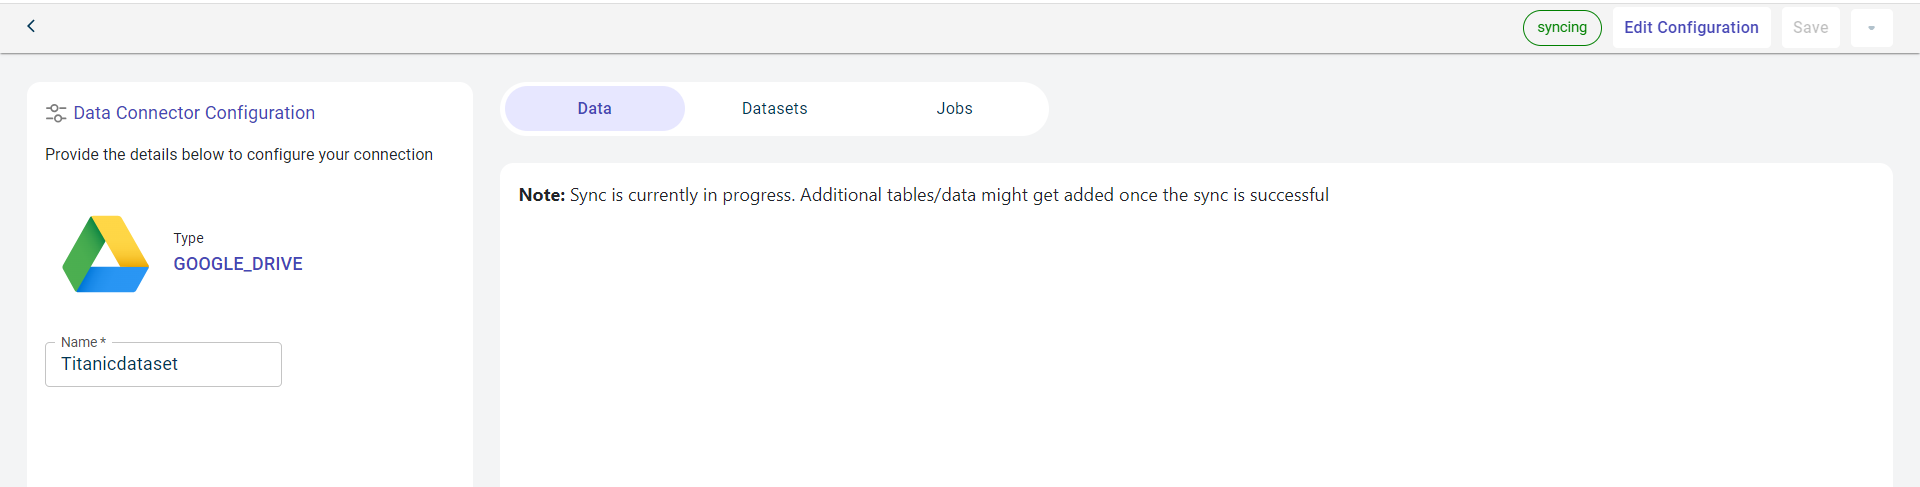
You can now view the datasets fetched from Google drive on this Data connector in the platform with the files and total records in each file. This is displayed in the table.
Importing dataset(s) to the canvas from the local system
Use this procedure to import the file to the canvas from the local system on which you want to perform the predictions and generate a modeling pipeline. The maximum number of files you can upload is 25, and the file size is 5GB.
To import the file from the local system:
Click the project to which you want to upload the file. The Canvas page is displayed.
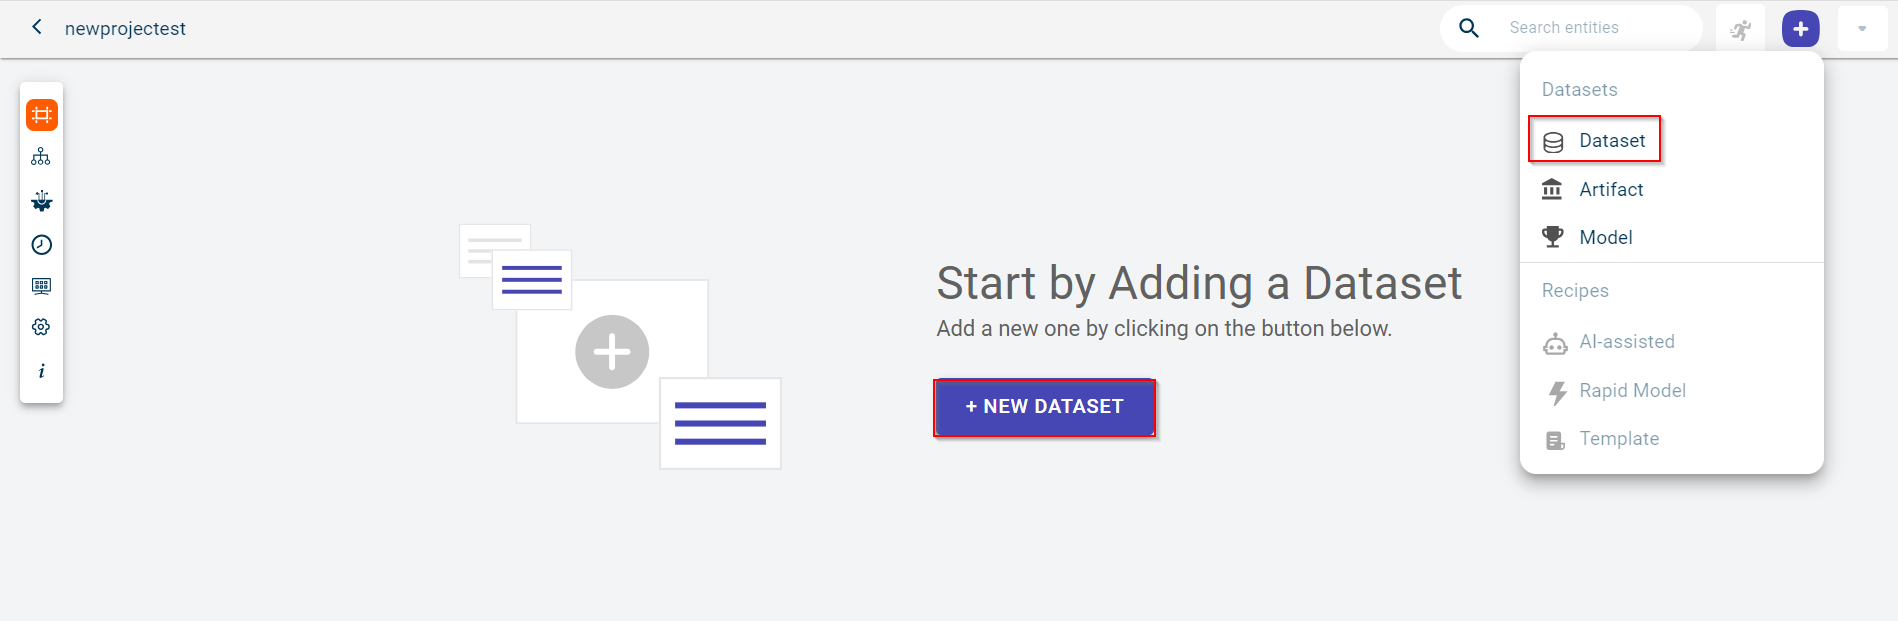
Click the plus icon
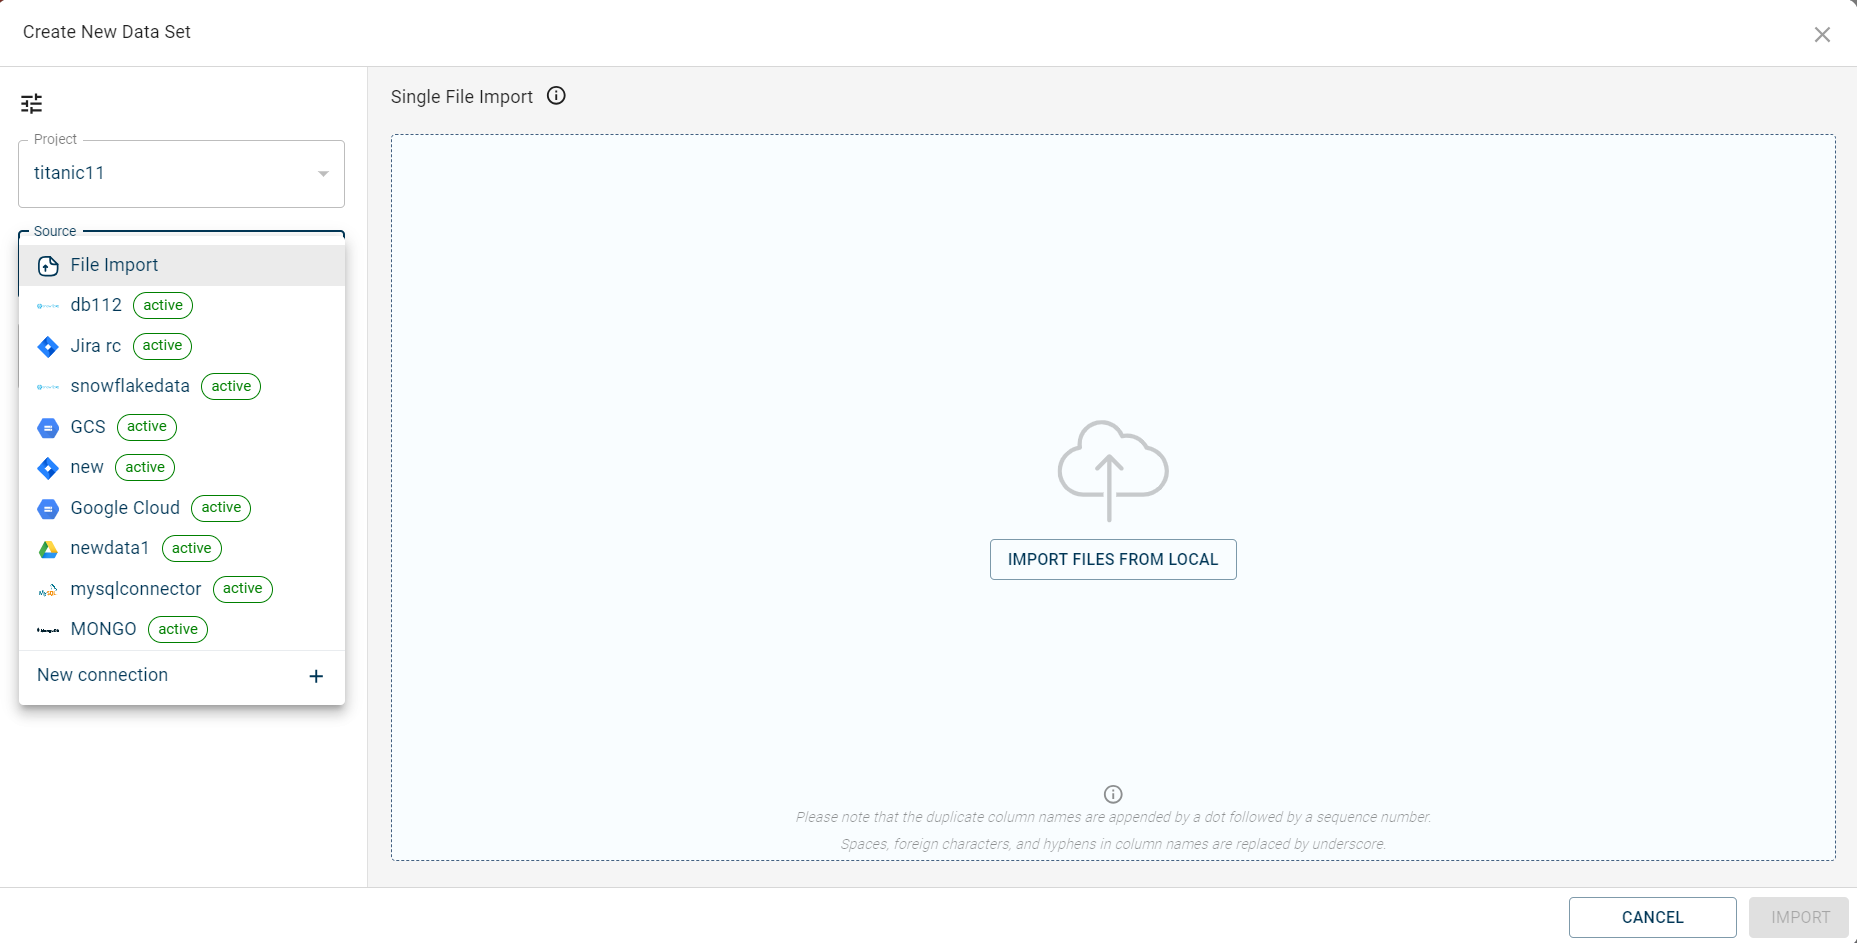
and select Dataset to navigate to the Create New Data set window.
You can also use the + NEW DATASET button. However, this option is displayed only when there are no datasets uploaded onto the canvas. The Create New Dataset page is displayed.
By default, the project name is populated in the Project field.
Select the source from where you want to upload. By default, File Import is selected.
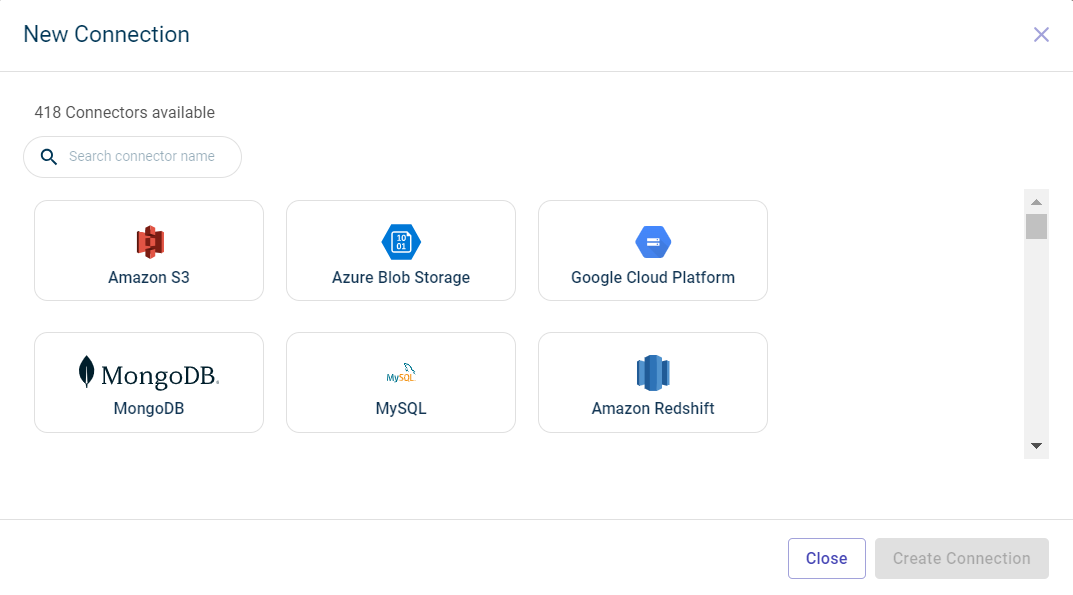
You can either upload the file from the local system or create a new connection using the +New Connection to import files from external Data connectors. For more information, see Connect to data connectors
After establishing the connection and importing the files, the imported files are populated in this drop-down list.
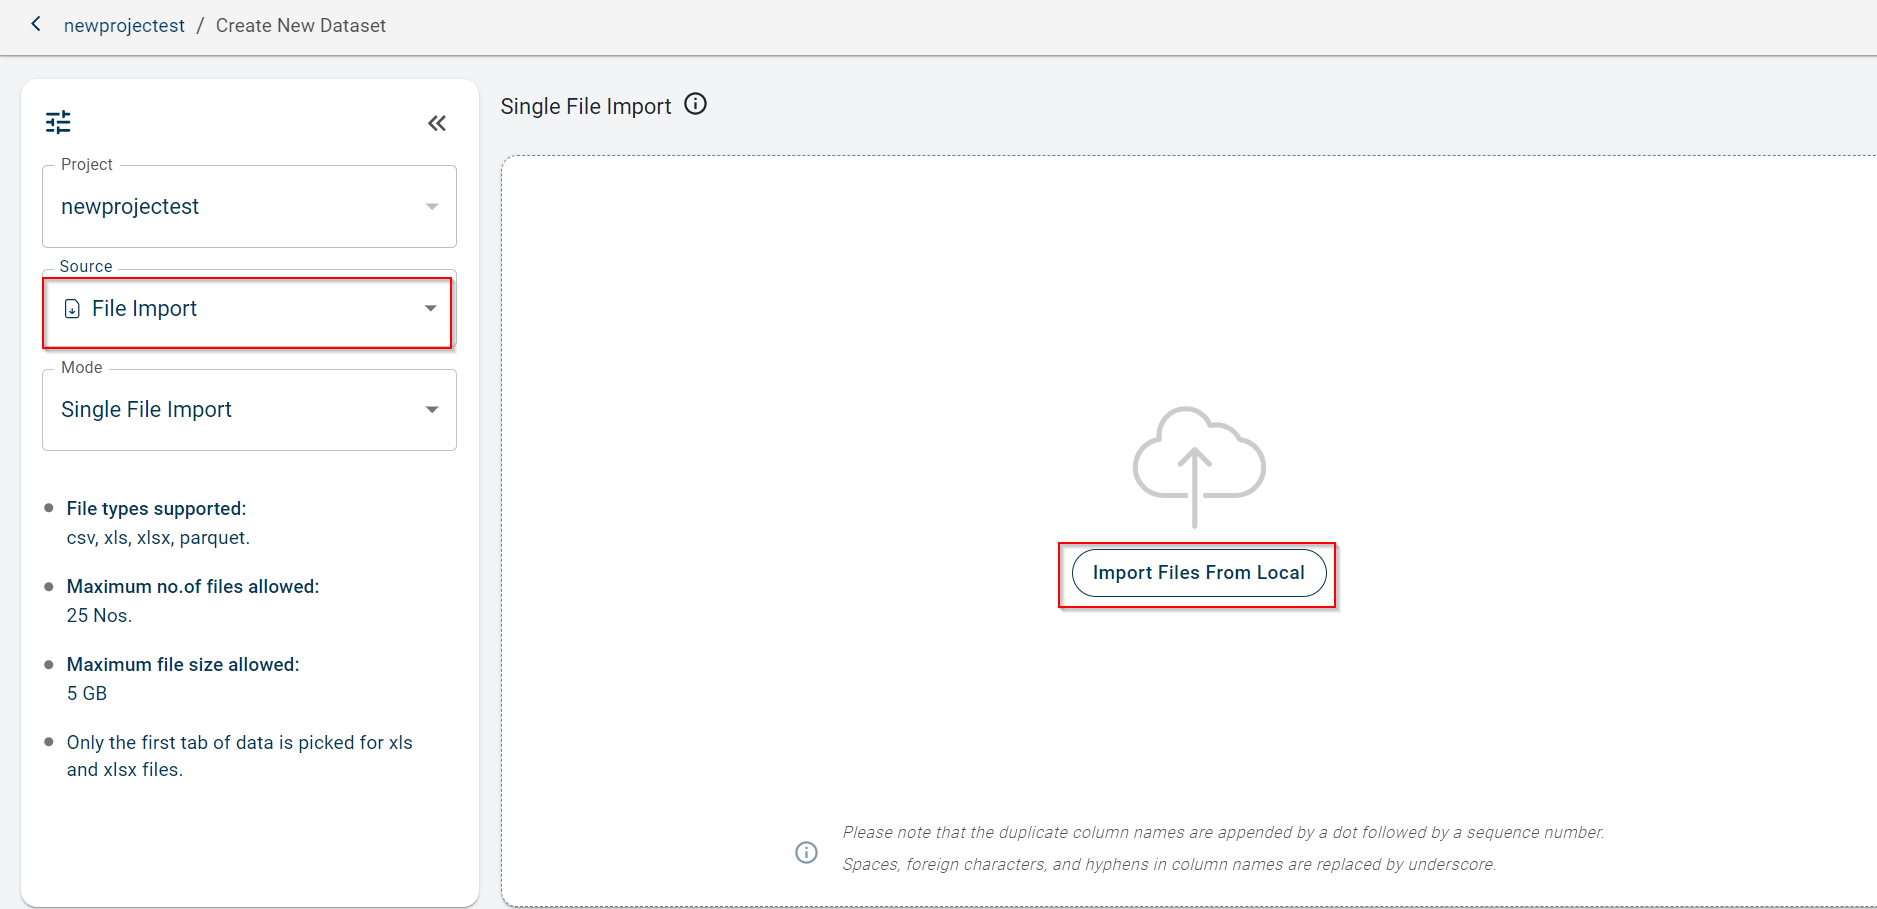
Select the Mode to upload the file. Possible options:
Single file import - Use this option to import only a single file onto the canvas.
Merge - Use this option to merge multiple files into one file. Ensure that schema in all the files is same.
Segregate - Use this option to upload multiple files together onto the canvas as separate files.
Select Single file upload.
Click Import Files from Local to browse and upload the file from your local system.
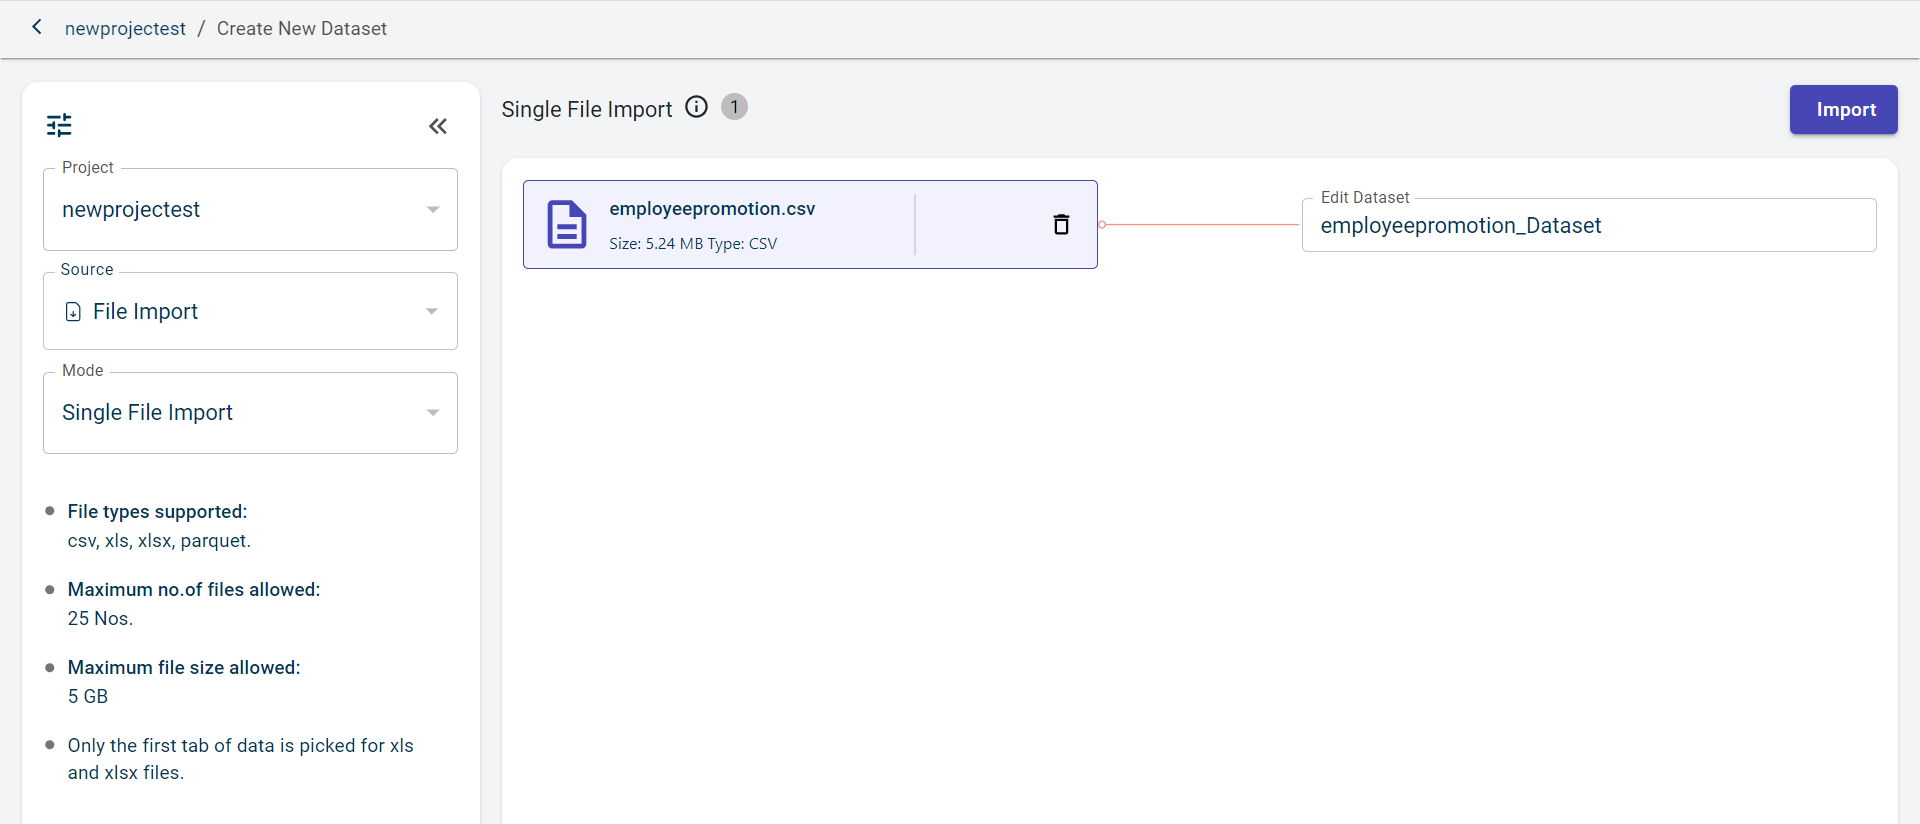
Click Import. Once the file is imported, you can view the file name and file size.
You can perform these actions:
If you want to delete the uploaded file, click the delete icon corresponding to this file name.
If you want to rename the file name, click the edit icon in the Dataset name.
Click File Configuration to expand and view the file configuration fields, such as Separator and Encoding
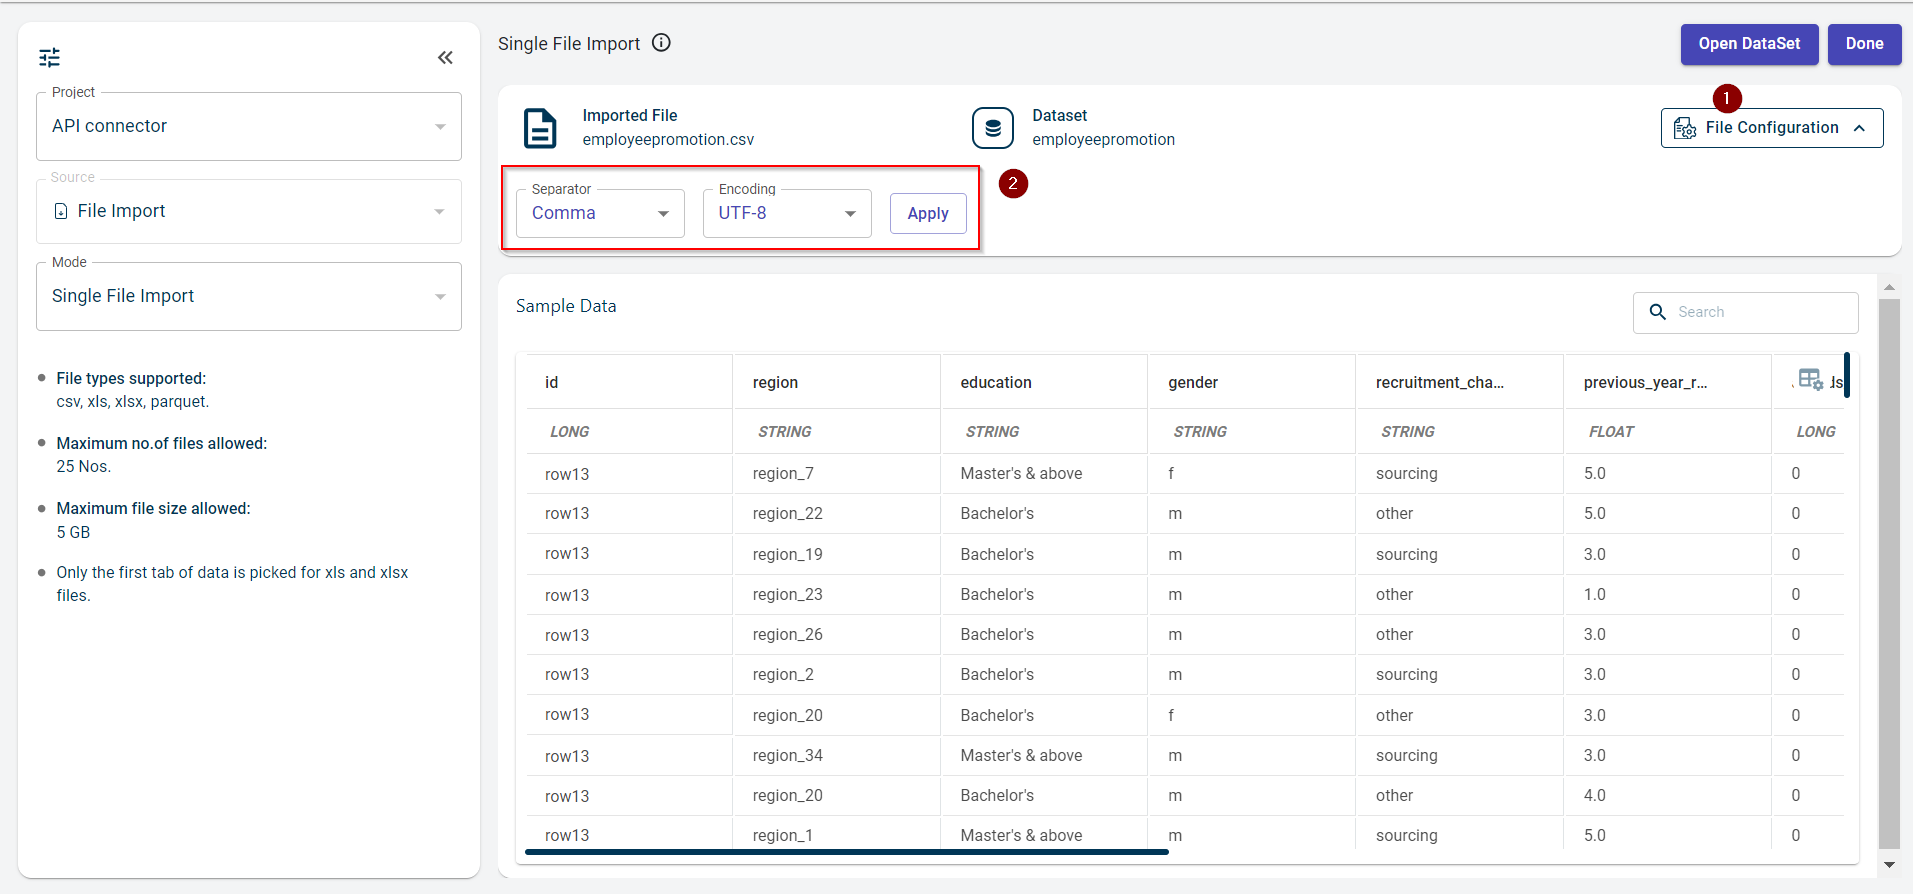
Separator and Encoding are auto-detected by the platform when you upload the file and this file has a single column containing all column names separated by a specified separator.
Note
The separator option allows you to split all the values separated by a separator into different columns.
Select separator from the drop-down list if the platform failed to auto-detect. Possible values:
Comma
Tab
Pipe
Colon
Semicolon
Select the encoding option if it is not auto-detected by the platform.
Click Apply to apply the separator and encoding options you have selected. Please note that these options are only available for CSV files.
You can now see the data in the file clicking the Open Dataset option. This takes you to the View data page.
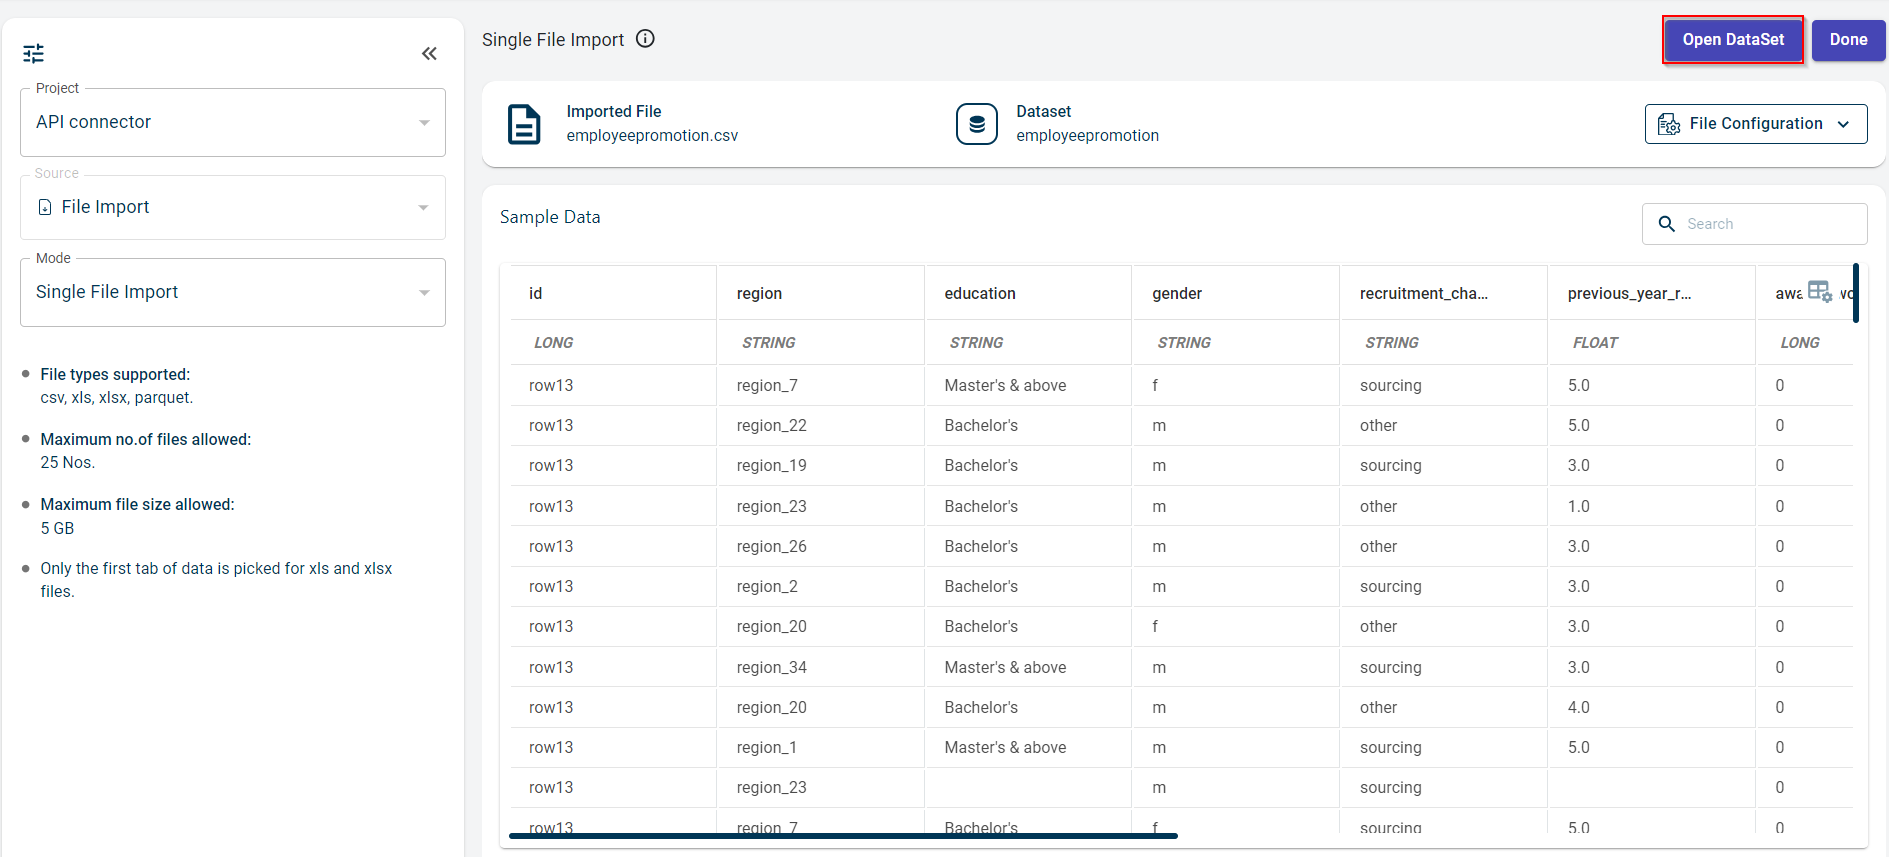
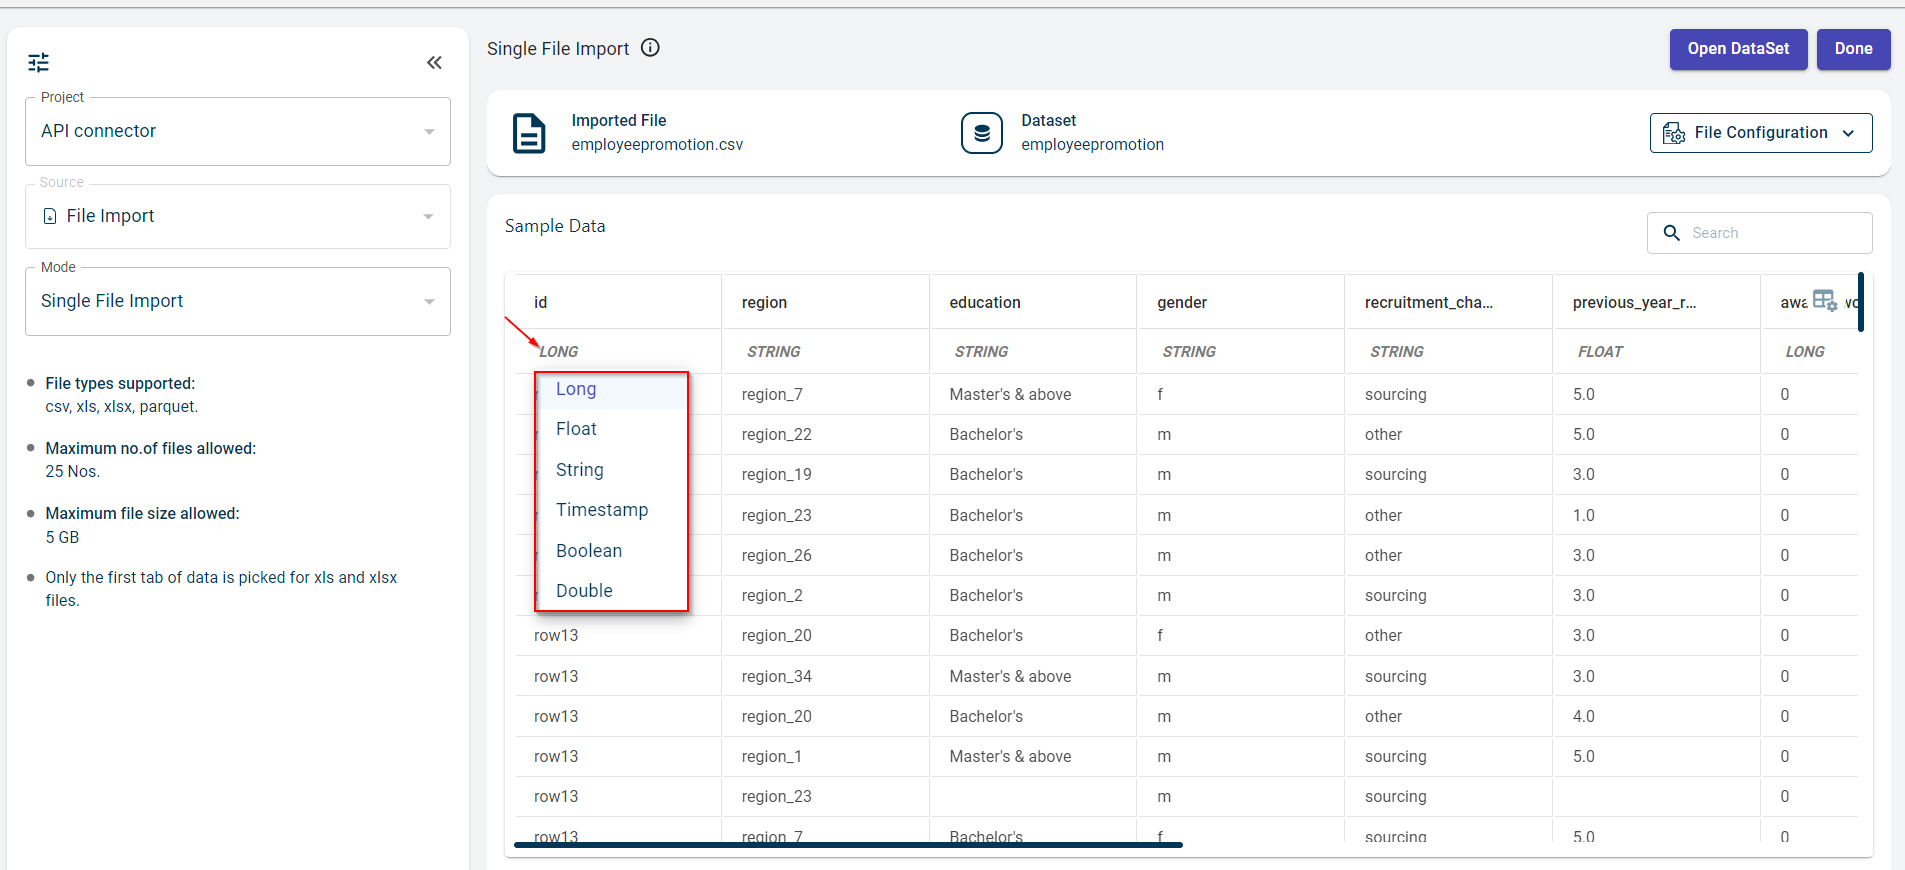
View the sample data and the data type of each column in the Sample Data section. To change the data type of a specific column, click the data type drop-down under the column name and select the new data type.
Click Done. Once the dataset is added, you are redirected to the Canvas view page where you can see the uploaded dataset node.
Viewing options in dataset pull-out window
Use this procedure to view all actions you can perform through pull-out window of a dataset.
To view dataset options:
Click on the dataset block on the canvas. This opens the pull-out window.
Perform any of these actions:
Click Preview to view the data in the file you have uploaded. For more information, see Viewing the dataset information.
Click the AI Guide icon to navigate to the AI Guide to query about the dataset.
Click the plus icon to select Template Recipe, AI-assisted Recipe or Rapid Model Recipe options. For more information, Recipes.
View about the significance of the dataset node. This AI snippet is only visible when the AI snippet generator is run. You can always update the content, using the Update content option.
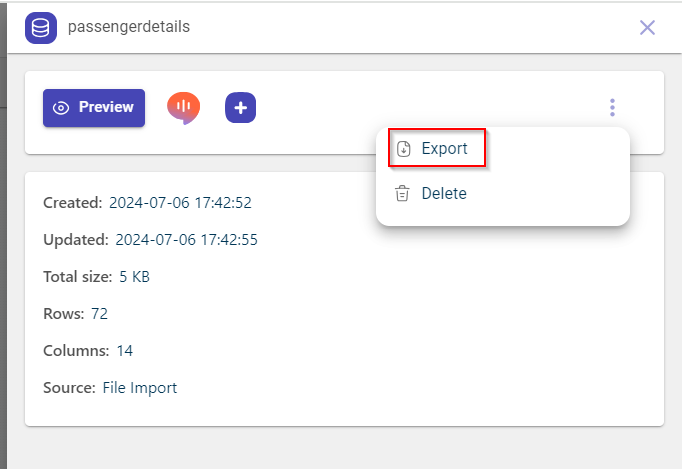
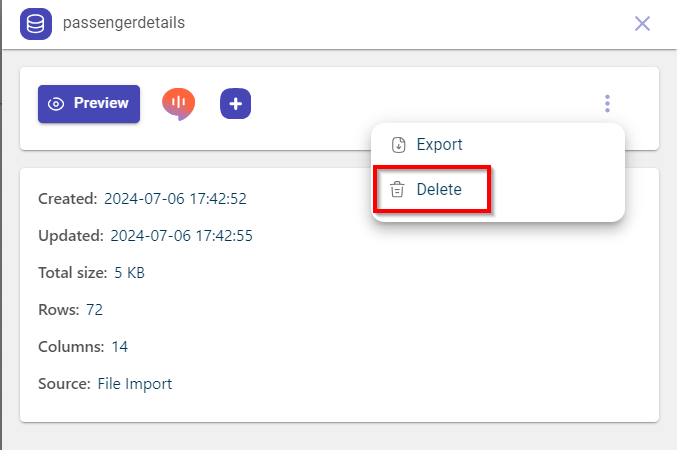
Click the ellipses icon and select Export to export the file onto your local system in csv format. For more information, see Exporting a dataset to the local system.
Note
You can view export as parquet and export as CSV options for the parquet equivalent files.
Click the ellipses icon and select**Delete** to delete the dataset. For more information, see Deleting the uploaded dataset.
View the summary of the dataset in the Summary section. You can create the summary in the Notebook.
Review these details:
- Created:
The date on which the file was uploaded.
- Updated:
The date on which the file was last updated.
- Total size:
The total file size.
- Rows:
The total number of rows in the file.
- Columns:
The total number of columns in the file.
- Source:
The source from where the dataset has been imported. Clicking on the file import will redirect you to the View data page.
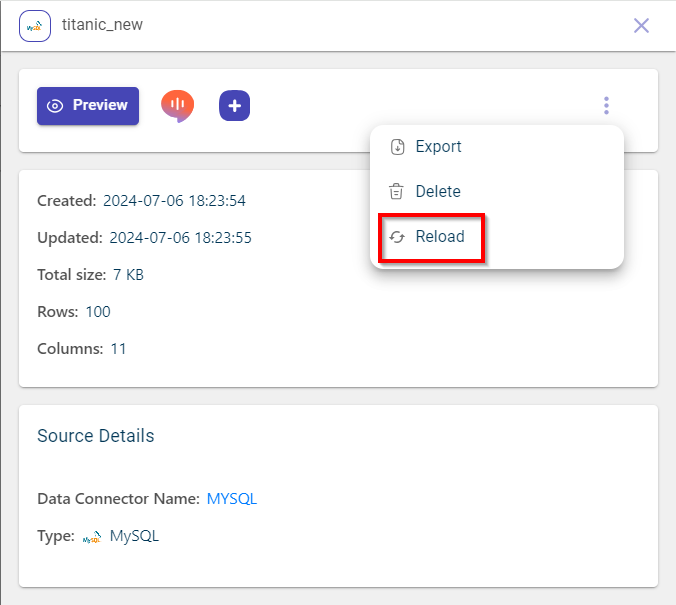
You can view the following source details if the dataset has been imported from connectors:
- Data connector name:
The name of the connector. Clicking on the link will redirect to the data connector configuration page.
- Type:
The type of connector.
If this is an output dataset, then you can view the Destination details section:
- Select the data connector to which you want to send the output dataset.
If the selected connector is GCS, then specify the destination folder name and destination file name and click Save to save these details. Later, you can export the file. You can always use the delete option to delete the configured destination.
If the selected connector is MySQL, then you must specify the table name. There will be two options, such as Append and Replace. You can select the Append option to append the dataset to the existing table provided both have the same schema, (or) select the replace option to replace the existing data and schema with new one. Once configured, click Save to save the details. Later, you can export the file.
If the selected connector is Snowflake, then you must specify the table name, database name, schema, warehouse and role. here will be two options, such as Append and Replace. You can select the Append option to append the dataset to the existing table provided both have the same schema, (or) select the replace option to replace the existing data and schema with new one. Once configured, click Save to save the details. Later, you can export the file.
Note
The fivetran connectors cannot be configured in the destination details.
Viewing the dataset information
Use this procedure to view the dataset information.
To view data:
Select the dataset block that you have uploaded onto the canvas. This opens the pull-out window.
Click Preview to navigate to the Data page. The records in the dataset are displayed in the tabular format.
View the data within each column of the dataset on the Data tab, where you can view the data type associated with each column. Use the search box to search with a specific term and obtain the results and use the clear option to clear the search and start fresh.
Click the ellipses icon corresponding to each column to use these options:
Hide - Hide the column in the table.
Sort ascending - Sort this column in the ascending order.
Sort descending - Sort this column in the descending order.
Search column - To search for the column name.
Click Resize Columns to adjust the column width and ensure the full column names are visible.
Click Schema to view the data type of each column in the loaded dataset.
Review the segments associated with this dataset, on the Segments tab.
- Name:
The name with which segment is created.
- Description:
The description for the segment.
- Created:
The date and time at which the segment is created.
- Rows:
The row limit for segmentation.
- Actions:
You can use the Edit icon to edit the segment details and the delete icon to delete the segment linked to this dataset.
Analyze the whole dataset to identify the missing values, total variables (Numeric, text, and categorical), total observations, duplicate values that help you clean up the data, on the Data Analysis tab.
Navigate to the Correlation tab to extract correlations and relationships within the data. The correlation heat map shows how each variable in the dataset is correlated with one another, as a color-coded matrix.
Navigate to the Alerts sub tab of the Data analysis tab where you can view the alerts and tagging given for those alerts.
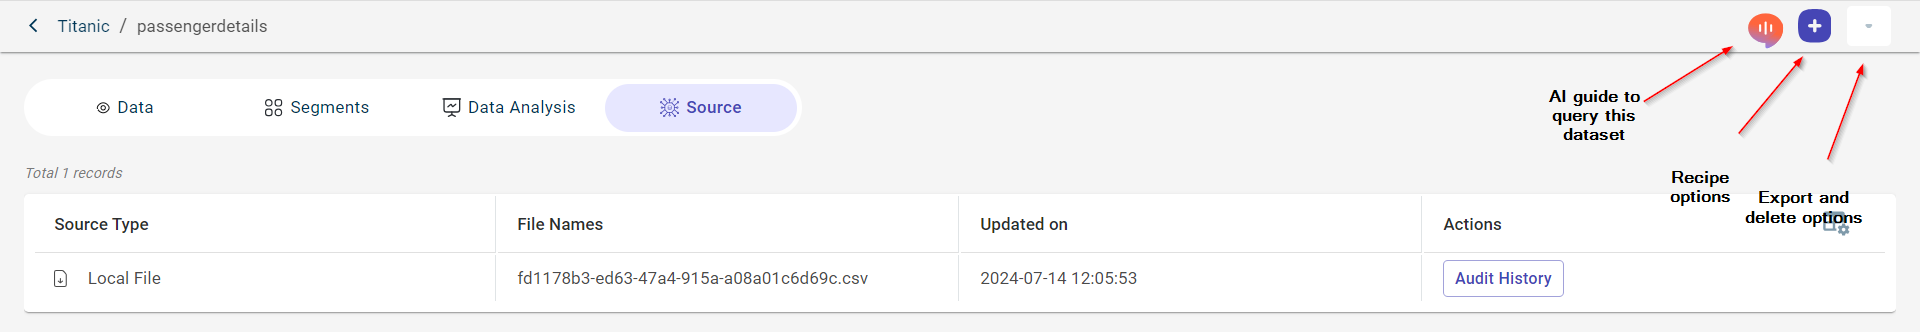
Click the Source tab. Please note that this tab is only visible for SQL based connectors. This allows you to modify the SQL query directly within the interface, ensuring that your dataset reflects the latest query data. Any changes made to the query will automatically update the dataset with the most current data available. However, updating the query data on the data pipeline will cause all related recipes linked to this dataset to move to an unbuilt state. To incorporate the changes, you will need to re-run the entire data flow.
Review the Source details:
Source Type - The type of source from which the dataset was imported. It should be SQL based connector. Connection Name - The name of the connector. Updated on - The date on which the connector was last updated. Query - Click Edit. This opens the query box. You can tweak the query and click Run Query to generate new dataset.
Click Save Query to update the query. Doing this replaces the existing data with the latest query data.
Click Yes, Replace on the dialog box. This updates the existing query with new SQL query.
Click Audit History in the Actions tab to check the log of user activities. Each entry will include the user who performed the action, type of action performed and timestamp.
You can perform the following actions on the data view page clicking the plus icon:
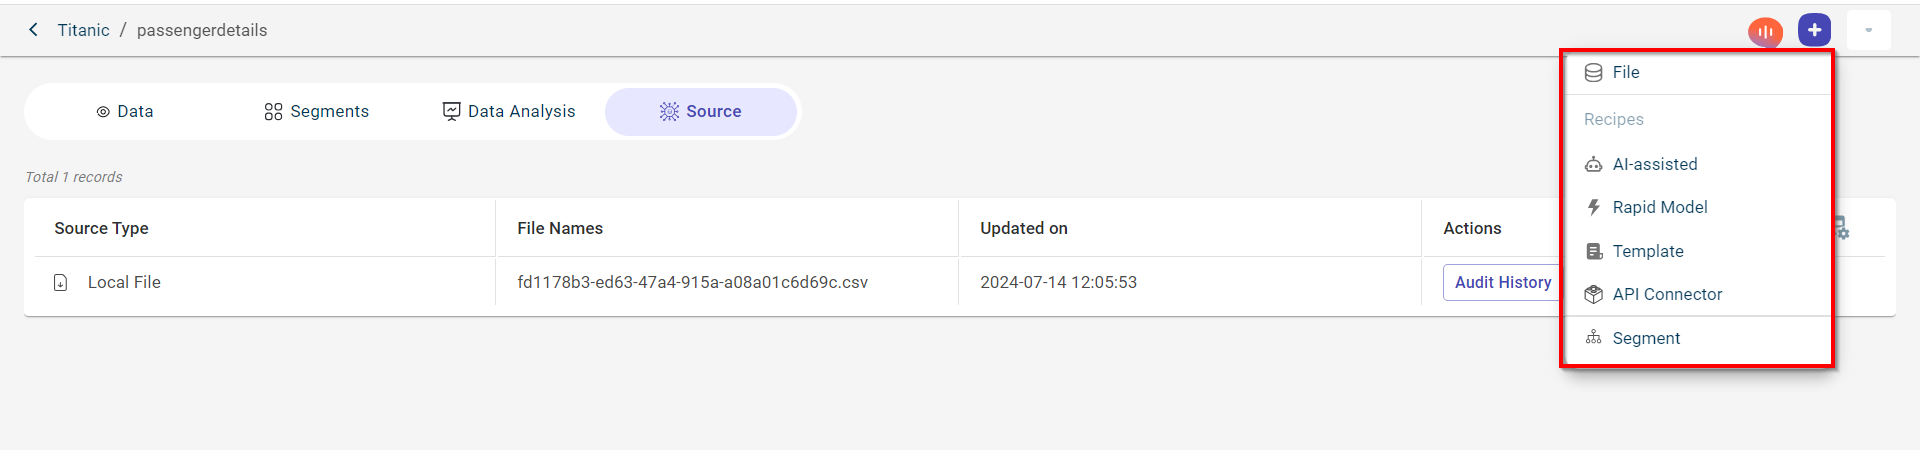
Append a new file to this dataset, clicking the plus icon and selecting the File option. By default, the criteria is set to Append. For more information, see Adding a file.
Add a template recipe to this dataset, using the Template option. For more information, see Adding a template recipe.
Add an AI-Assisted recipe to this dataset, using the AI-assisted option. For more information, see Adding an AI assisted recipe.
Run the rapid canvas model recipe, using the Rapid Model option. For more information, see Developing ML models using Rapid model recipe.
Add a segment to this dataset, using the Segment option. For more information, see Creating a custom segment. This option is available only for the source dataset.
You can perform the following action clicking the Actions drop-down:
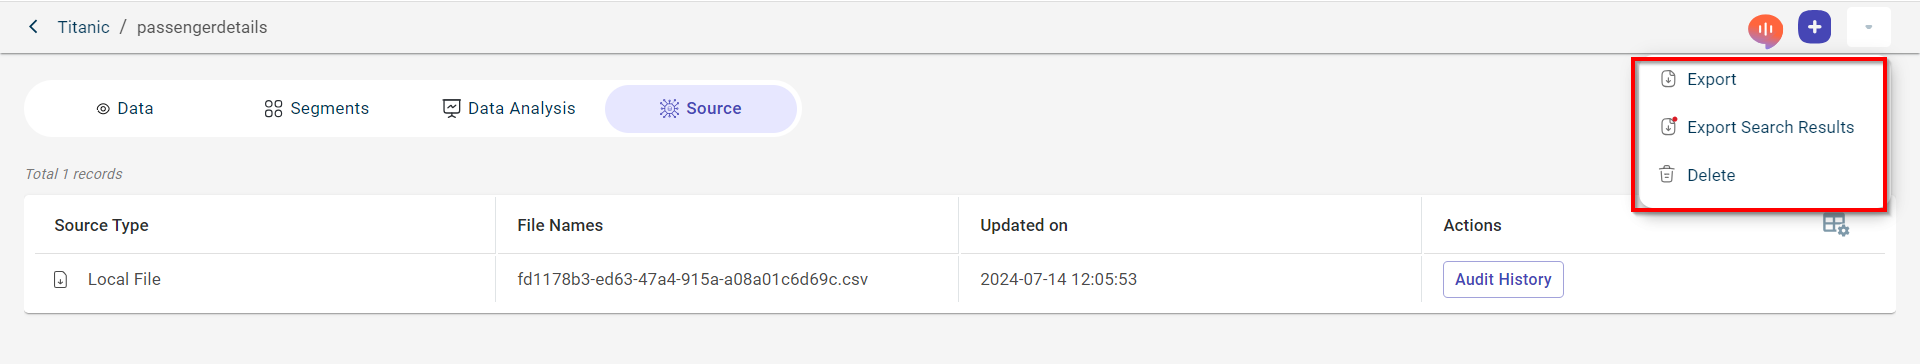
Download the dataset, using the Export option. For more information, see Exporting a dataset to the local system.
Use the Export Search Results option in the Data tab to export only the results for your specific search term. After conducting a search, you can export just the results obtained for that term
Delete the dataset and associated recipes with the dataset, using the Delete option.
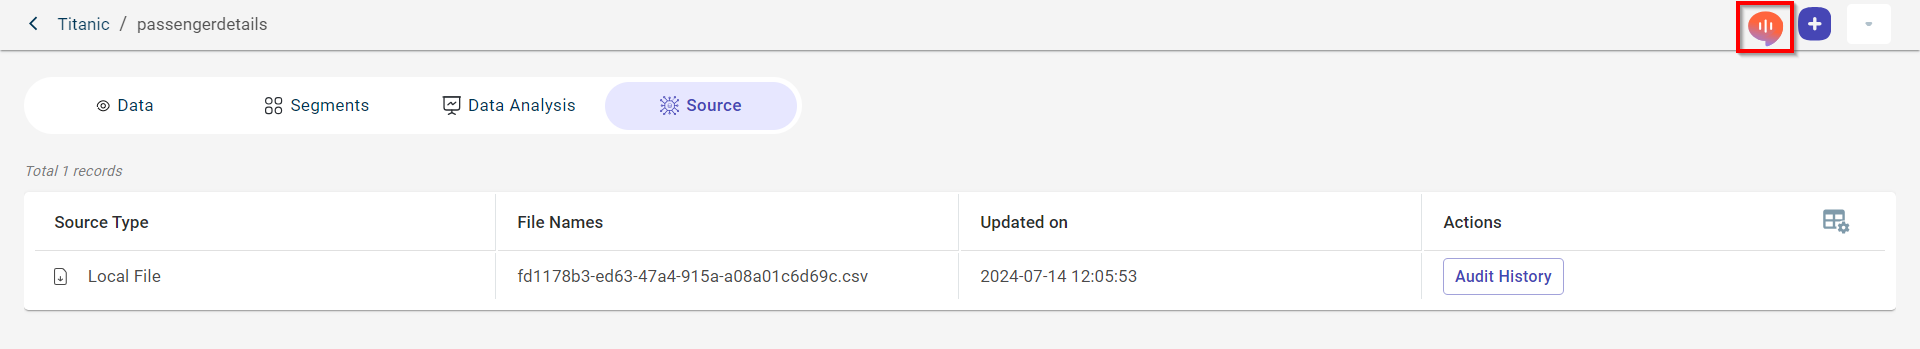
You can also use the AI guide to query on this dataset, using the AI guide icon.
Exporting a dataset to the local system
Use this procedure to download the input and output dataset to your local system in the csv file format.
To export a dataset:
Select the dataset block that you have uploaded onto the canvas. This opens the pull-out window.
Click Export to download the dataset in csv format to your local system.
You can also export the dataset from the dataset page, using the Export option. This dataset page is displayed clicking Preview in the side panel.
Deleting the uploaded dataset
Use this procedure to delete a dataset block from the canvas.
To delete a dataset block:
Select the dataset block that you want to delete from the canvas. This opens the pull-out window.
Click Delete to delete the dataset.
A dialog box prompts that deleting the dataset also deletes the recipes associated with it.
Click Delete to delete the dataset permanently from the project or click Cancel to discard the action.
Reloading latest datasets from fivetran connector
Use this procedure to reload fresh data from the fivetran connector. This dataset syncs with the remote storage and retrieves the latest dataset.
To reload a dataset:
Select the dataset block that you want to reload from the canvas. This opens the side panel.
Click Reload to reload the dataset.
3.A dialog appears. Click Reload to fetch the latest dataset. Ensure that the schema of this dataset same as the current one.
Importing text files to the canvas from the local system
Use this procedure to import text files from the local system on which you want to perform the predictions and generate a modeling pipeline.
To import the text file from the local system:
Click the project to which you want to upload the file. The Canvas page is displayed.
Click the plus icon
and select Text to navigate to the Create New File page.By default, the project name is populated in the Project field.
Select the source from where you want to upload. By default, File Import is selected.
You can either upload the file from the local system or create a new connection using the +New Connection to import files from external Data connectors. For more information, see Connect to data connectors
Supported file formats - .txt, .json, .html, .md
Connector types supported - Amazon S3, Azure blob storage, and Google Cloud Platform.
After establishing the connection and importing the files, the imported files are populated in this drop-down list.
Select the Mode to upload the file. Possible options:
Single file import - Use this option to import only a single file onto the canvas.
Segregate - Use this option to upload multiple files together onto the canvas as separate files.
Select Single file Import.
Click Import Files from Local to browse and upload the file from your local system.
Click Import. Once the file is imported, you can view the file name and file size.
You can now see the data in the file clicking the Open Text Input option. This takes you to the Data page to view the data.
Click Done. Once the file is added, you are redirected to the Canvas view page where you can see the uploaded file node.
Viewing the file information
Use this procedure to view the file information.
To view data:
Select the text block that you have uploaded onto the canvas. This opens the side sheet.
Click Preview to navigate to the Data page.
View the data within the text file you have uploaded on the Data tab.
Click the Source tab.
Review the Source details:
:Source Type:- The type of source from which the file was imported. :File Names: - The name of the file. :Updated on: - The date on which the file was last updated. :Audit History: - Click Audit History to check the log of user activities. Each entry will include the user who performed the action, type of action performed and timestamp.
You can perform the following actions on the data view page clicking the plus icon:
Update file - Replace the existing file with new file.
Template - Select template recipe to run this recipe on the file data.
Code- Select code recipe to run the recipe on the file data.
You can perform the following action clicking the Actions drop-down:
Download the file, using the Export as Markdown option. You can export the file in the format you have uploaded it.
Delete the file and associated recipes with the dataset, using the Delete option.
Configuring destination details for output datasets
When working on the canvas, you may generate an output dataset. You can configure the destination details to specify where the latest output dataset will be stored each time the canvas flow runs.
Steps to Configure Destination Details:
Select the Output Dataset – Click on the output dataset block on the canvas to open the side sheet.
Choose a Data Connector – Select the connector where you want to save the output dataset. The available fields will vary based on the selected connector.
Specify Table Name (for MySQL Connector) – If using a MySQL database connector, enter the table name where the output dataset should be stored.
Set Save Mode – Choose either:
Append – Adds the new data to the existing dataset, provided both share the same schema.
Replace – Replaces the existing dataset with the latest output.
Save the Configuration – Click Save to apply the changes. You can then use the Export option to send the dataset to the selected connector.
Once saved, the destination connector appears as a node on the canvas, serving as a visual indicator that the output dataset is linked to a destination.
Additional Actions
Delete Connector – Remove the connector linked to the output dataset using the Delete button.
Preview Data – Click Preview to view the contents of the dataset.
Use AI Guide – Get AI-generated prompts to explore and analyze the dataset.
Run Recipes – Click the + (plus) button to apply different recipes and perform data transformations.
Export Dataset – Click the ellipses(⋮) icon to export the dataset as CSV or Parquet.
Delete Dataset – Click the ellipses(⋮) icon to remove the output dataset from the canvas