Canvas overview
Canvas is a workspace where you can create flows or machine learning models by importing datasets and adding recipes. After you create a project, you will be navigated to the Canvas where you can create, test, and train models using various recipe types. There are predefined templates available for data cleaning, data preparation, data analysis, feature engineering, model building, model prediction, and visualization. Specifically, the AI-assisted recipe enables you to provide the text prompt to generate the code recipe in seconds and use it in the pipeline. You can use a rapid canvas recipe to run end-to-end ML flow automatically by uploading a dataset.
You can perform the following tasks on the canvas to create flows:
Input the dataset
Execute or run recipes (Template, AI-assisted or rapid model)
Get the output dataset or a chart, or model
Getting familiar with these areas will help business users to build models more efficiently without writing any Python code or ML expertise. With a user-friendly interface, any user can get started with building machine learning models.
Building blocks and significance
The following are the building blocks you view while building the data pipeline.
Icon |
Name |
Description |
|---|---|---|
Dataset |
This icon represents a dataset. It is displayed when you import a dataset onto the canvas successfully, or when a dataset is generated after running a recipe. |
|
Recipe |
This icon represents a recipe. It executes various transforms related to data cleaning, preparation, analysis, feature engineering, model building, prediction and visualization. |
|
Dashboard |
This icon represents a dashboard. You can visualize the data presented in the form of charts and scatter plots. |
|
Unbuilt recipe |
This icon represents a recipe added to the flow but has no transformations added. |
|
Running the recipe |
This icon represents the recipe execution in progress. |
|
Error |
This icon represents a recipe error. It is displayed when the recipe is failed during its execution. |
|
Model |
This icon represents a model that is generated after running a recipe. |
|
Artifact |
This icon represents an artifact generated after running a recipe. |
|
Empty dataset |
This icon represents an empty output dataset. It is displayed when the recipe run is in progress. |
|
Empty recipe |
This icon represents a recipe added to the flow but is not executed. |
|

|
API Connector recipe |
This icon represents API connector recipe added to the flow. |
Dag view options
Use these Dag view options to change the view of the data pipeline.
Icon |
Name |
Description |
|---|---|---|
 |
Zoom in |
Use this option to enlarge the DAG. |
 |
Zoom out |
Use this option to shrink the DAG. |
 |
Fit view |
Use this option to fit the Dag into the size of the screen. |
 |
auto arrange canvas nodes |
Use this option to auto arrange canvas nodes. This formats the building blocks and lines in the flow to make it easier to read. It also ensure that the connectors do not overlap with another. |
 |
Curved connector |
Use this option to use curved lines for aligning the building blocks. |
 |
Straight connector |
Use this option to use straight lines for aligning the building blocks. |
 |
Save canvas nodes orientation |
Use this option to save the order in which you arranged the building blocks on the canvas manually. |
 |
Expand all |
Use this option to expand all the nodes in the data pipeline. |
 |
Collapse all |
Use this option to collapse all the nodes in the data pipeline. |
 |
Snippet Generator |
Use this option to generate AI snippet for each node on the canvas. |
Shortcut options on canvas
You can perform quick actions on different components on the canvas, such as dataset, artifact, recipe, model and chart, using the shortcut options. You must right-click on each component to view these options.
Source dataset – Preview, Add AI-assisted recipe, Add Rapid Model recipe, Template recipe, API Connector recipe, AI Guide, Add File, Export, delete, and Collapse. The Reload option is available for datasets imported through data connectors, allowing you to fetch the latest data as needed.
Recipe – Preview, Run recipe, check the logs, delete the recipe, stop recipe (this option is visible only when the recipe run is in progress), and Collapse.
Chart – Preview and delete
Model – Preview, create prediction service, AI Guide, AI-assisted recipe, Template recipe, API Connector recipe, and delete.
Artifact – Preview, AI-assisted recipe, Template recipe, API Connector recipe, and Delete.
Output dataset - Preview, Add AI-assisted recipe, Add Rapid Model recipe, Template recipe, API Connector recipe, AI Guide, Add Destination, Export, and delete.
Unbuild recipe - Preview, Run Recipe, Logs, Delete, and Collapse
Unbuild output dataset - Preview, +Add destination, and Delete
Unbuilt chart - Delete
Unbuilt model - Preview, Prediction Service, and Delete
Unbuild artifact - Preview and delete
Unbuilt source file - Preview, Add file, and Delete. If the source file is uploaded from connectors, then you can view Reload option instead of Add file.
Various options to create a machine learning flow on the canvas
Use these options to build machine learning flows.
How to access?
Click on the plus icon  on the canvas to see these options under Datasets and Recipes:
Option |
Description |
|---|---|
Dataset |
The option to upload a dataset onto the canvas to do the predictions. |
Artifact |
The option to add artifacts onto the canvas. |
Model |
The option to add an existing model to the canvas. |
Template |
The option to add preexisting templates to the canvas to perform data cleaning, data pre-processing, feature engineering and model building. |
AI-assisted |
The option to use AI to generate the recipes or templates you want by providing a text prompt. |
Rapid Model |
The option to build machine learning models automatically by uploading the dataset and selecting the problem type. |
AI Connector Recipe |
The option to write Python code to generate datasets and run recipes. |
The other options you can view on the canvas are:
Run
Run: Select this option to execute the recipes using the data currently available in the datasets on the canvas. This option will remain disabled until recipes are added to the canvas.
Run with Fresh Data: Select this option when you have fetched data from data connectors onto the canvas. This will retrieve fresh data and run the data pipeline.
RapidCanvas AI guide to generate the steps required to develop a model for the selected use case.
Click the drop-down to switch between scenarios within the project.
Search for a specific entity in the canvas, using the Search entities option.
Queuing the recipes
When triggering multiple recipes on the canvas, subsequent recipes are queued if the first recipe run is in progress using the queuing recipe feature. For the first recipe, you can view the run option. In case, you want to run a series of other recipes on the canvas, you can right-click on the desired recipe to see the Add to Queue option. Clicking this option will add the recipe to the queue.
Use this procedure to queue the recipe in the data pipeline.
Select the project to navigate to the canvas view page.
Right-click on the first recipe node on the canvas and click the Run option. Subsequently, to run another recipe, right-click to see Add to queue option.
Click the Recipe queue icon besides the Run button. You can view the list of recipes in the queue to run in the sequential order.
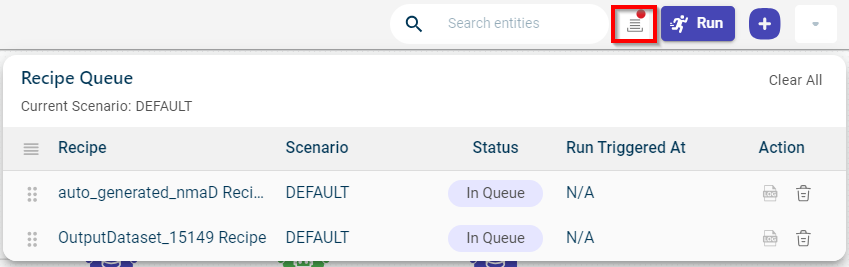
Review the recipes in the queue:
- Recipe:
The name of the recipe.
- Scenario:
The scenario in which the recipe is being run.
- Status:
The status of the recipe. Possible values:
Running - Recipe run is in progress
In Queue - Recipe is in queue as the other recipe run is in progress
Success - Recipe run is successful
Error - Encountered an error while running the recipe
- Run Triggered at:
The time at which the recipe run was triggered.
- Action:
Use the delete icon to remove the recipe from the queue.
Use the log icon to view the recipe logs. In case the recipe fails, you can check the logs to identify and fix the issue.
You can also do the following in the recipe queue:
Click Clear all to clear all recipes in the queue.
Use the reorder option next to each recipe to change the order in which the recipes should run.
AI Guide
The AI guide feature is available for datasets, model, charts, and rapid canvas recipe.
Datasets and Models
To access the AI Guide for datasets or models, right-click on the respective dataset or model block. This redirects you to the AI Guide page. This will initiate a chat interface where you can interact with the AI specifically regarding the dataset or model you have selected. You can also ask a follow-up question on the response received.
Accessing AI guide from a dataset
Charts
For charts, the process is slightly different. First, click on the chart block on the canvas. This action will open the charts page, where each chart has an AI Guide option. Clicking on the AI Guide for a particular chart will allow you to chat with the AI, asking questions and receiving guidance pertinent to the chart data.
Using the AI Guide
Once you access the AI Guide for a dataset, model, or chart, you can engage in an interactive chat with the AI. Users can ask questions related to the data within the selected component. For example, when working with a dataset, you can inquire about missing values or specific data points. For models, you can ask about performance metrics, training data details, or request explanations on how certain predictions are made.
The AskAI guide will provide dynamic prompt suggestions that adapt to your query, improving the relevance and guidance provided.
For charts, you can ask for insights derived from the visual data, such as trends, outliers, or comparisons.
See also
To learn more about the other tabs on canvas, read the following sections: