EDA Data profiler
This transform helps to understand the key characteristics of a dataset, including its structure, patterns, and relationships between variables. This also returns the missing values.
tags: [“Data Preparation”, “Cleaning”]
Parameters
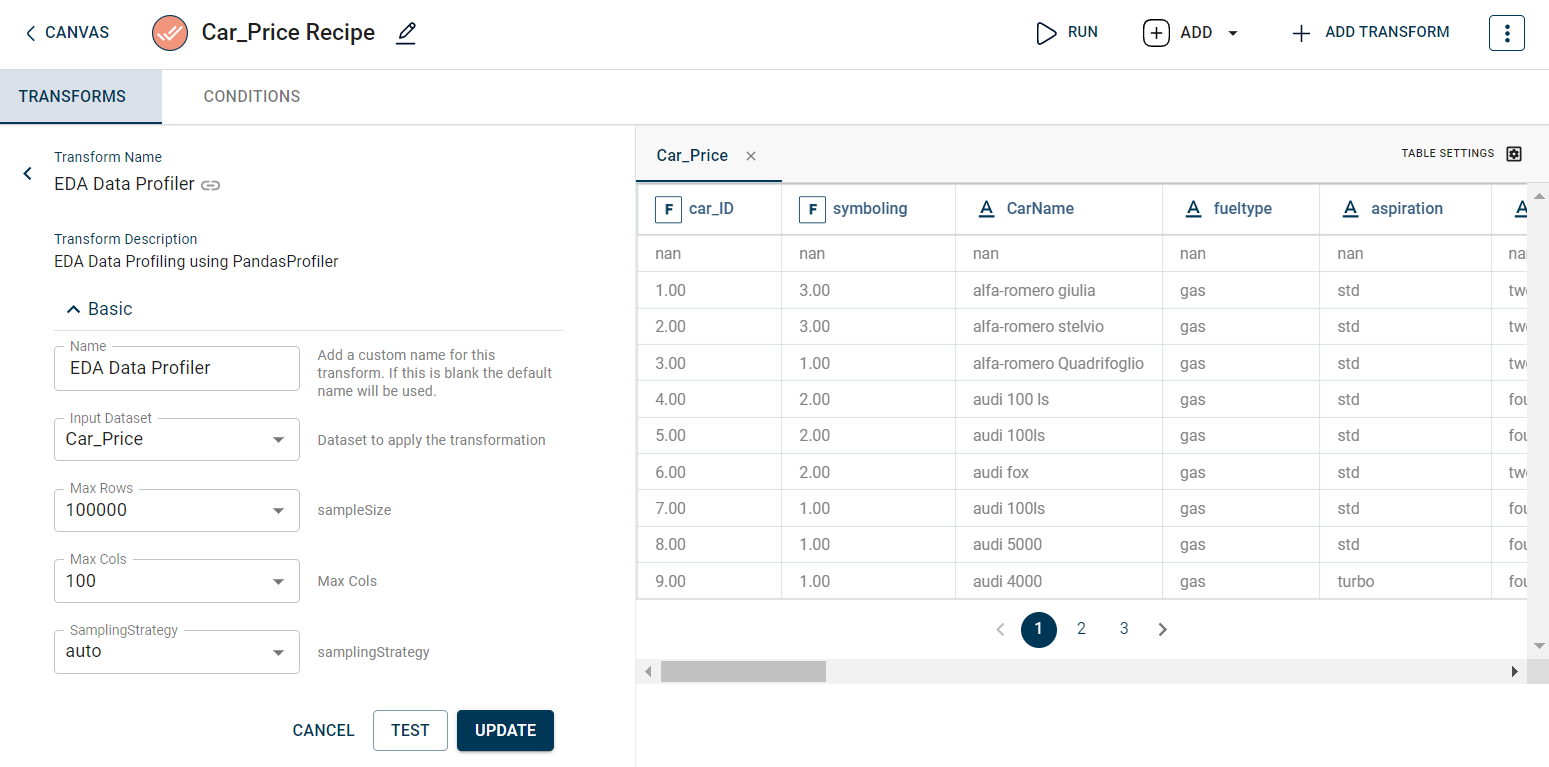
The table gives a brief description about each parameter in EDA Data profiler transform.
- Name:
The name for the transform. By default, a name is populated. However, you can provide a custom name for the transform.
- Input Dataset:
The file name of the input dataset. You can select the dataset that was uploaded from the drop-down list to create meaningful insights from the raw data. (Required: True, Multiple: False)
- Max Rows:
The maximum number of rows on which this transform can be executed.
- Max cols:
The maximum number of columns on which this transform can be executed.
- SamplingStrategy:
The sampling strategy used. Possible values:
auto
full
sample
- Output Dataset:
The file name with which the output dataset is created. (Required: True, Multiple: False)
The sample input for this transform looks as below:

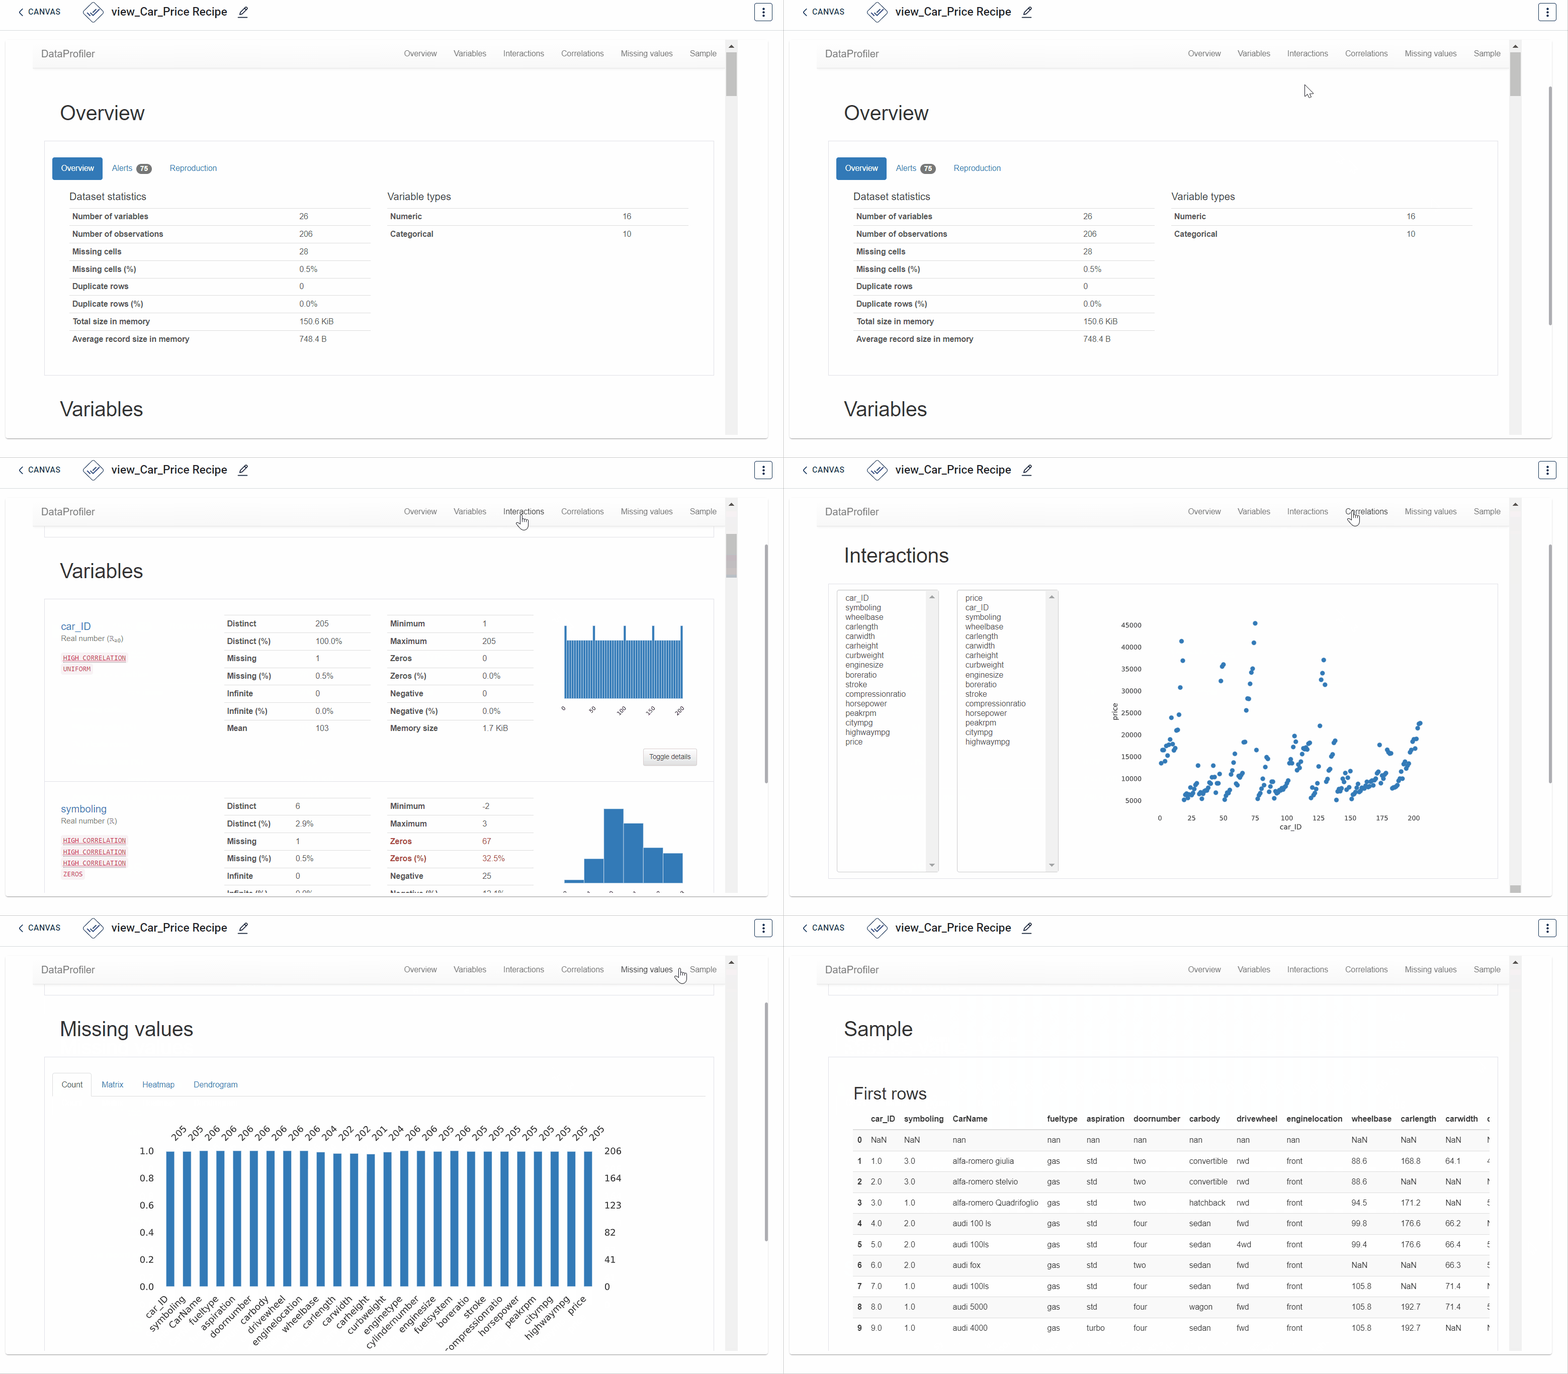
The output after running the EDA Data profiler transform on the dataset appears as below. Various characteristics you can understand include- missing values in the dataset, overview, variables, correlations and sample:

How to use it in Notebook
The following is the code snippet you must use in the Jupyter Notebook editor to run the EDA Data profiler transform:
transform = Transform()
transform.templateId = eda_data_profiler.id
transform.name = "EDA Data Profiler"
transform.variables = {"inputDataset": dataset_input_name}
recipe = project.addRecipe([dataset_input], name="Pandas Profiler")
#recipe.prepareForLocal(transform, contextId="eda")
recipe.addTransform(transform)
recipe.run()
Requirements
pandas